Fig. 1
Download original image
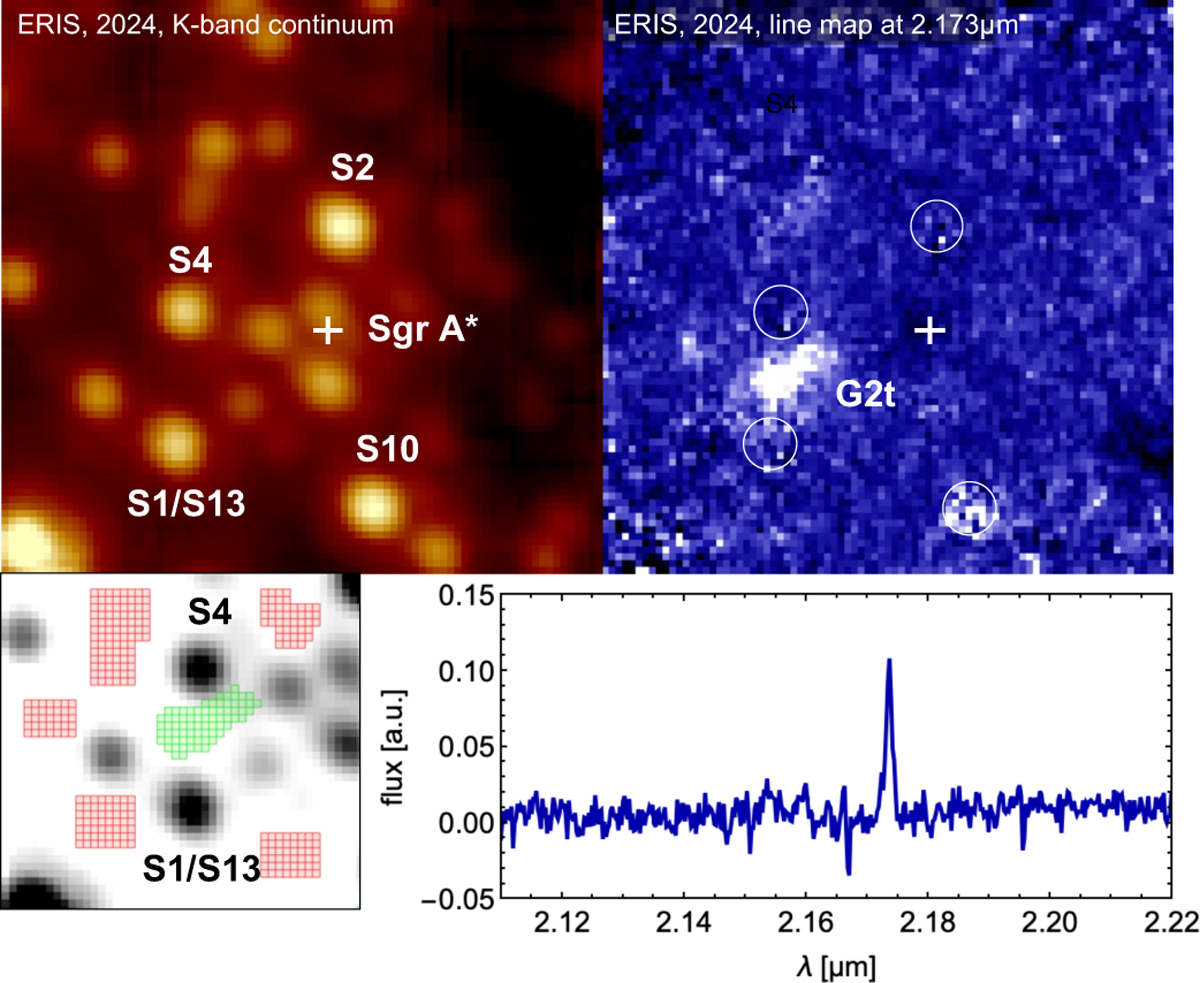
G2t in the ERIS integral-field data from June/July 2024. Top left: continuum image showing the S-stars. Top right: Background-subtracted line map centered at 2.173 µm, corresponding to Brackett-γ + 1000 km/s. G2t stands out. Bottom left: example of a pixel selection (on – green, off – red) for extracting the G2t spectrum overlaid on the continuum map. Bottom right: Resulting spectrum showing a strong emission line at 2.173 µm.
Current usage metrics show cumulative count of Article Views (full-text article views including HTML views, PDF and ePub downloads, according to the available data) and Abstracts Views on Vision4Press platform.
Data correspond to usage on the plateform after 2015. The current usage metrics is available 48-96 hours after online publication and is updated daily on week days.
Initial download of the metrics may take a while.