Fig. 1
Download original image
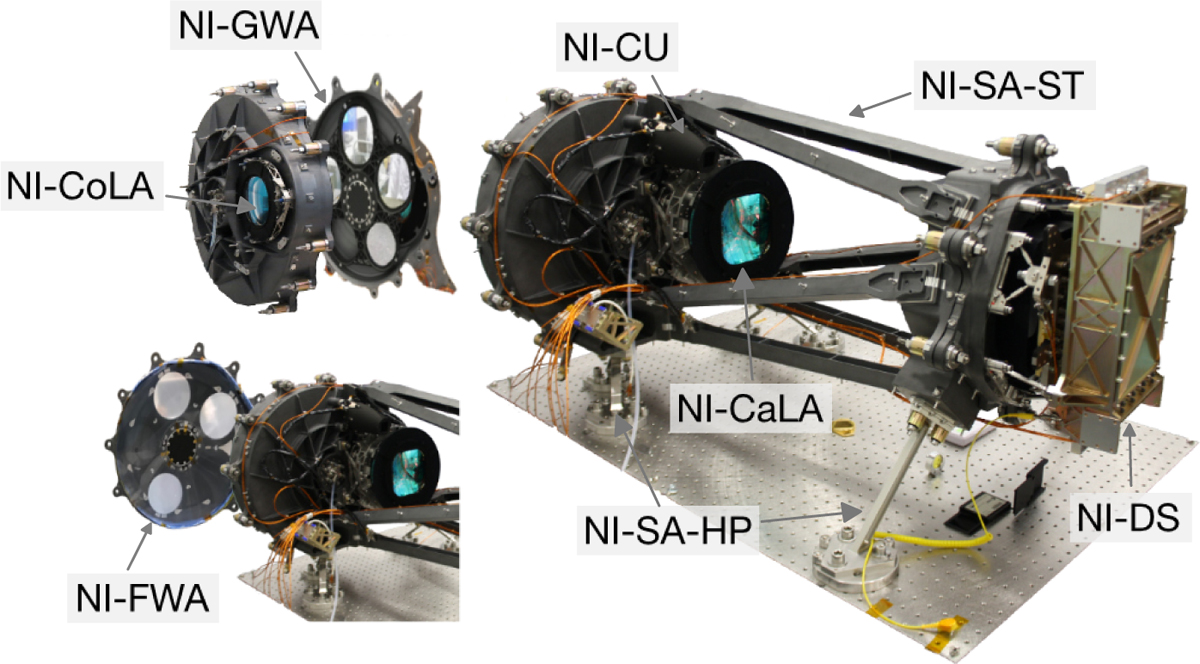
Schematic view of the NISP instrument detailing its subsystems. Right: view of the whole instrument as integrated. Left: detailed view with an open wheel cavity, showing the locations of the two wheels to select spectral elements. Not shown are the ‘warm’ electronics, which are used for commands and data processing; they are located away from the main NISP instrument assembly in Euclid’s service module (Maciaszek et al. 2016). The subsystem names and functions are described in the main text.
Current usage metrics show cumulative count of Article Views (full-text article views including HTML views, PDF and ePub downloads, according to the available data) and Abstracts Views on Vision4Press platform.
Data correspond to usage on the plateform after 2015. The current usage metrics is available 48-96 hours after online publication and is updated daily on week days.
Initial download of the metrics may take a while.