Open Access
Fig. 11
Download original image
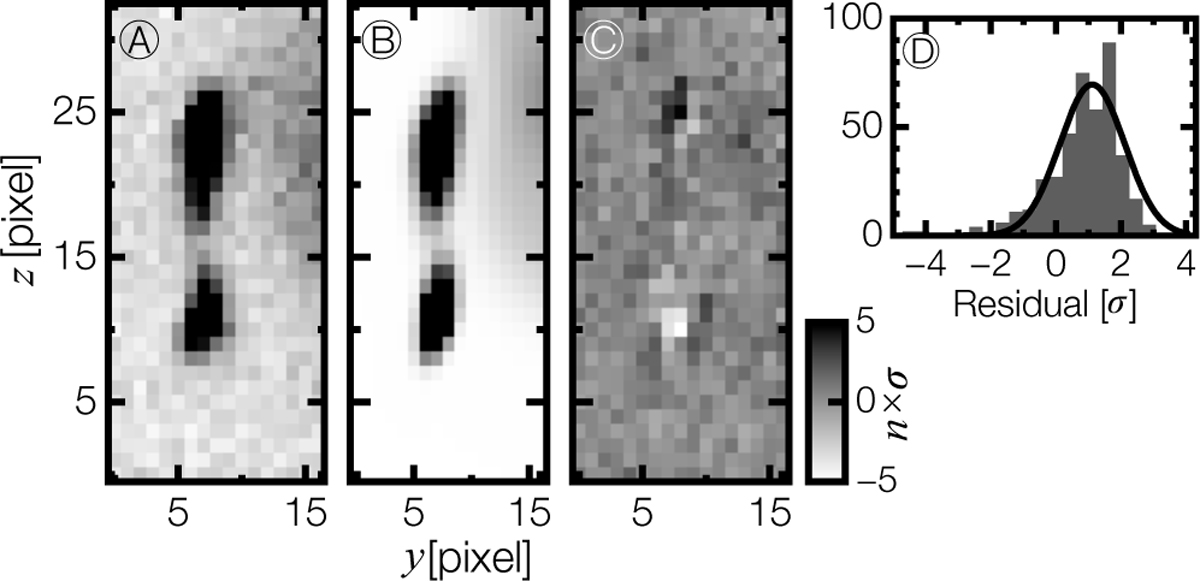
Example of the outcome of a template fit of the zeroth-order spectrogram. Panel A: image of the Fabry–Pérot zeroth-order spectrogram as acquired by the RGS000. Panel B: modelled image resulting from the template fit. Panel C: residual of the template fit. Panel D: residual distribution.
Current usage metrics show cumulative count of Article Views (full-text article views including HTML views, PDF and ePub downloads, according to the available data) and Abstracts Views on Vision4Press platform.
Data correspond to usage on the plateform after 2015. The current usage metrics is available 48-96 hours after online publication and is updated daily on week days.
Initial download of the metrics may take a while.