Open Access
Fig. 13
Download original image
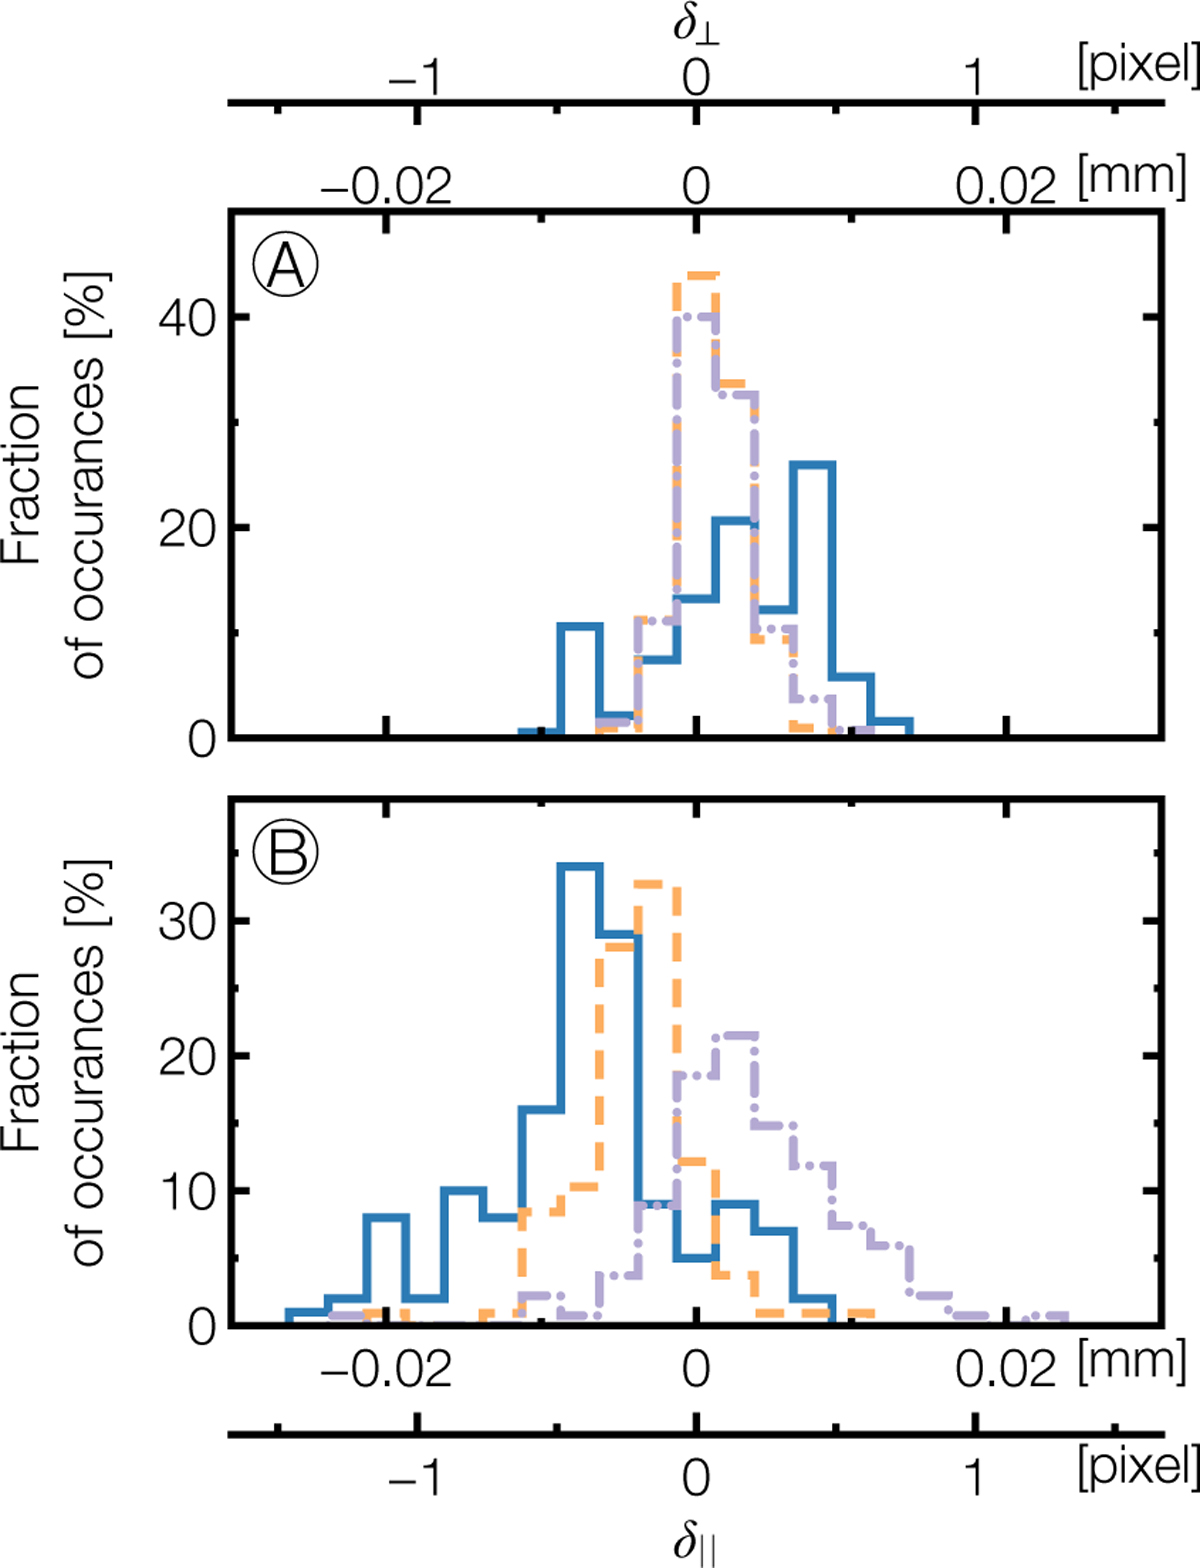
Histograms of the distances between measured and predicted argon line positions across the NISP FoV in the cross-dispersion direction, δ⊥ (A), and in the dispersion direction, δ∥ (B) – for the argon spectrograms captured with BGS000 (blue line), RGS000 (dashed yellow line), and RGS180 (dot-dashed purple line).
Current usage metrics show cumulative count of Article Views (full-text article views including HTML views, PDF and ePub downloads, according to the available data) and Abstracts Views on Vision4Press platform.
Data correspond to usage on the plateform after 2015. The current usage metrics is available 48-96 hours after online publication and is updated daily on week days.
Initial download of the metrics may take a while.