Fig. 15
Download original image
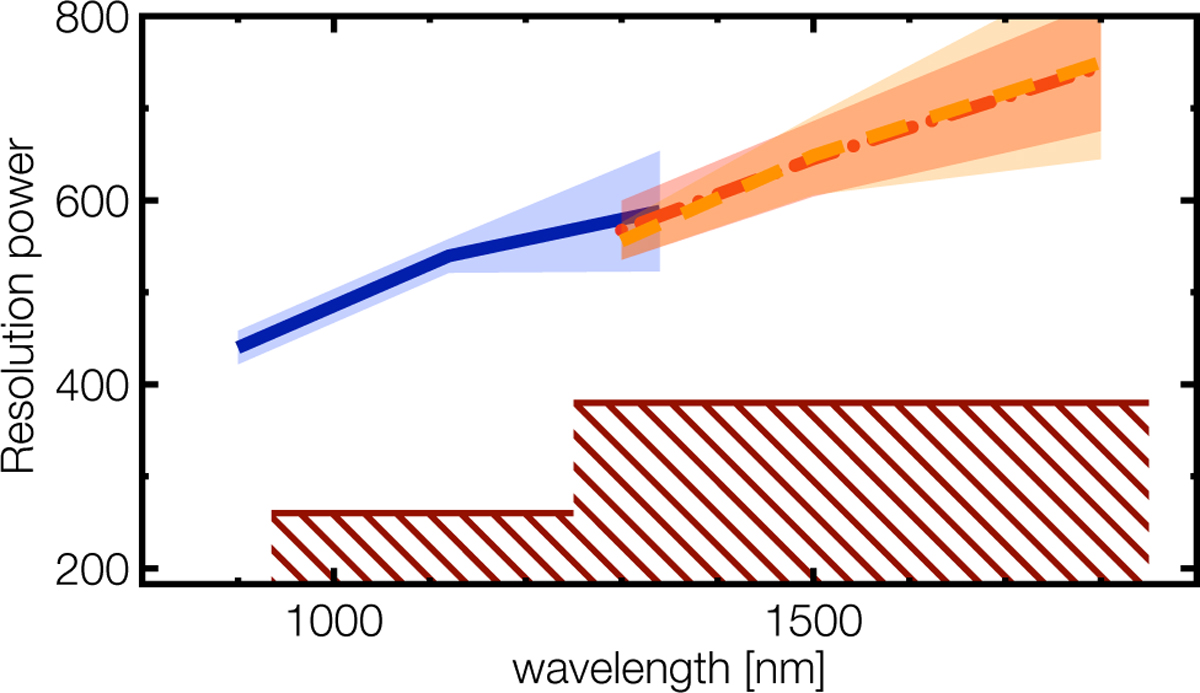
NISP’s averaged resolving power for the BGS000 (line), RGS000 (dashed), and RGS180 (dot-dashed) grisms as a function of wavelength, assuming a source size of 0.″5 FWHM. The shaded areas illustrate the variation in the resolving power due to the variation in the PSF and the variation in the dispersion, ∆λ, across the FoV. The hatched region shows the ‘forbidden’ region below the scientific requirements.
Current usage metrics show cumulative count of Article Views (full-text article views including HTML views, PDF and ePub downloads, according to the available data) and Abstracts Views on Vision4Press platform.
Data correspond to usage on the plateform after 2015. The current usage metrics is available 48-96 hours after online publication and is updated daily on week days.
Initial download of the metrics may take a while.