Fig. 5
Download original image
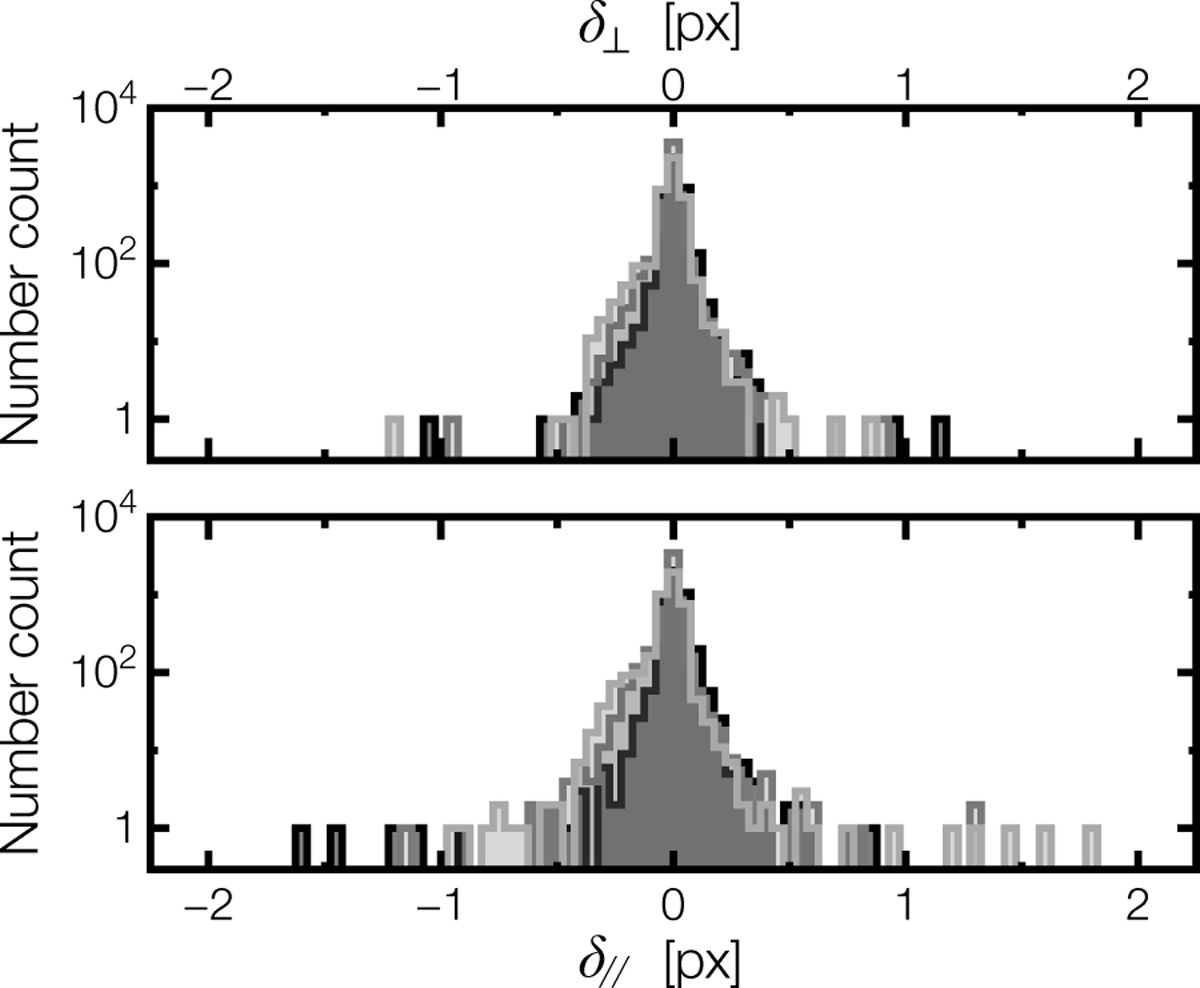
Differences in the measured position of the PSF centroid for the various models used. Top: difference in position in the cross-dispersion direction (δ⊥). Bottom: difference in position in the dispersion direction (δ∥). In both panels, the number count axis is logarithmic. The black histogram compares the elliptical Moffat profile to the dual-Gaussian profile. The grey histogram compares the asymmetric-Gaussian profile to the dual-Gaussian profile. The light grey histogram compares the asymmetric-Gaussian profile with the elliptical Moffat profile.
Current usage metrics show cumulative count of Article Views (full-text article views including HTML views, PDF and ePub downloads, according to the available data) and Abstracts Views on Vision4Press platform.
Data correspond to usage on the plateform after 2015. The current usage metrics is available 48-96 hours after online publication and is updated daily on week days.
Initial download of the metrics may take a while.