Fig. 9
Download original image
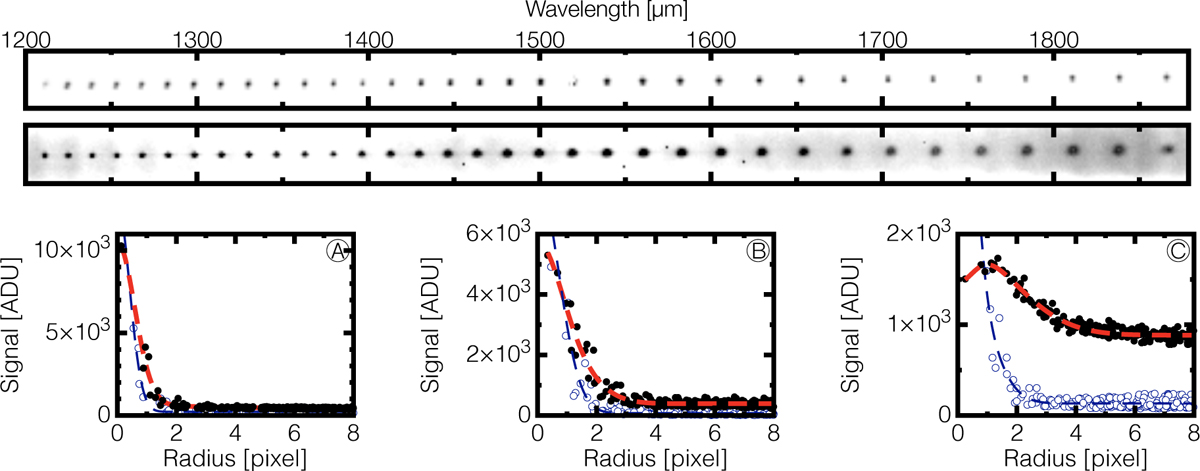
Top: image of the Fabry–Pérot etalon spectrum acquired with the NISP grism RGS000 during the instrument test campaign. Middle: image of the Fabry–Pérot etalon spectrum acquired with the NISP grism RGS270 during the instrument test campaign. Bottom: spot size of the Fabry– Pérot emission lines displayed as radial profiles at 1300 nm (A), 1540 nm (B), and 1840 nm (C). Measurement points are marked by open circle for RGS000 and dots for RGS270. The dashed lines are a radial-profile fit with a double Gaussian to emphasise the shape of the PSF. This functional form allows one of the two Gaussian to have the negative amplitude needed to reproduce the ring-shape of the RGS270’s PSF at large wavelengths.
Current usage metrics show cumulative count of Article Views (full-text article views including HTML views, PDF and ePub downloads, according to the available data) and Abstracts Views on Vision4Press platform.
Data correspond to usage on the plateform after 2015. The current usage metrics is available 48-96 hours after online publication and is updated daily on week days.
Initial download of the metrics may take a while.