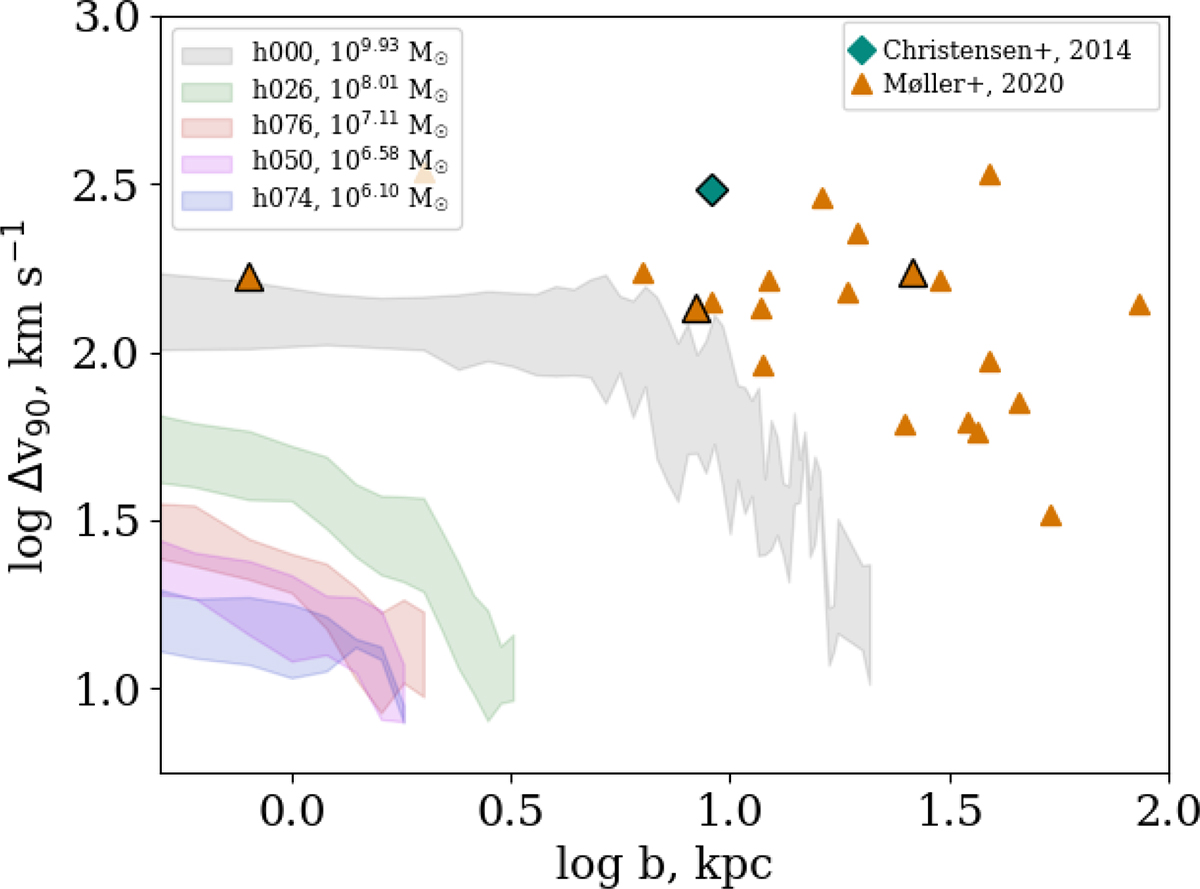
Fig. E.1.
Download original image
Velocity widths vs. impact parameter in the simulated galaxies at z = 2.55 compared to the data obtained from observations in emission by Christensen et al. (2014) (orange triangles) and Møller & Christensen (2020) (green diamonds). The highlighted symbols correspond to the systems studied in Velichko et al. (2024) (see Table 1).
Current usage metrics show cumulative count of Article Views (full-text article views including HTML views, PDF and ePub downloads, according to the available data) and Abstracts Views on Vision4Press platform.
Data correspond to usage on the plateform after 2015. The current usage metrics is available 48-96 hours after online publication and is updated daily on week days.
Initial download of the metrics may take a while.