Fig. 3.
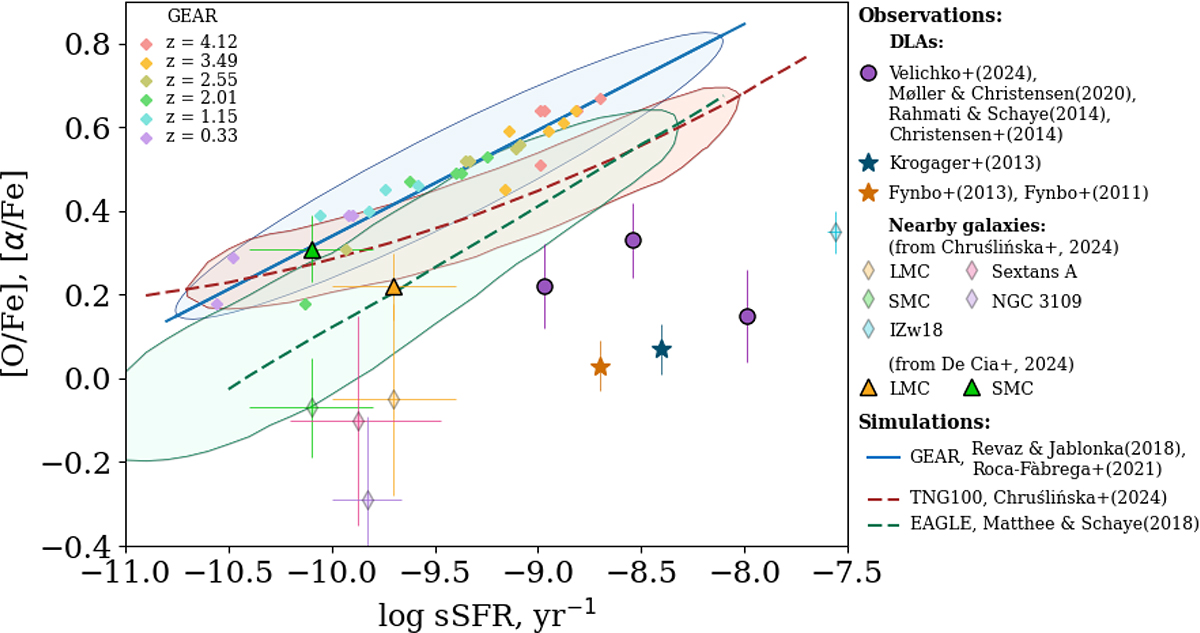
Download original image
[α/Fe] or [O/Fe] versus specific star formation rate in gas. Small filled diamonds represent [O/Fe] from GEAR (Revaz & Jablonka 2018; Roca-Fàbrega et al. 2021), which we fit with the solid blue line and a 3σ probability distribution function (blue shaded area). For comparison, the dashed brown and green curves, with corresponding contours, show [O/Fe] versus sSFR from the TNG100 (Chruślińska et al. 2024) and EAGLE (Matthee & Schaye 2018; Chruślińska et al. 2024) cosmological simulations, respectively. The measurements of [α/Fe] from absorption spectra of DLAs were taken from Velichko et al. (2024) (circles) and from Krogager et al. (2013), Fynbo et al. (2011), and Fynbo et al. (2013); we corrected the latter two for dust depletion (stars). The measurements of sSFRs were obtained by Møller & Christensen (2020), Christensen et al. (2014), Rahmati & Schaye (2014), Krogager et al. (2013), Fynbo et al. (2013), and Fynbo et al. (2011). The data for nearby galaxies (LMC, SMC, IZw 18, Sextans A, and NGC 3109) were taken from De Cia et al. (2024) and/or Chruślińska et al. (2024). All the abundances were converted to the Asplund et al. (2021) solar scale.
Current usage metrics show cumulative count of Article Views (full-text article views including HTML views, PDF and ePub downloads, according to the available data) and Abstracts Views on Vision4Press platform.
Data correspond to usage on the plateform after 2015. The current usage metrics is available 48-96 hours after online publication and is updated daily on week days.
Initial download of the metrics may take a while.