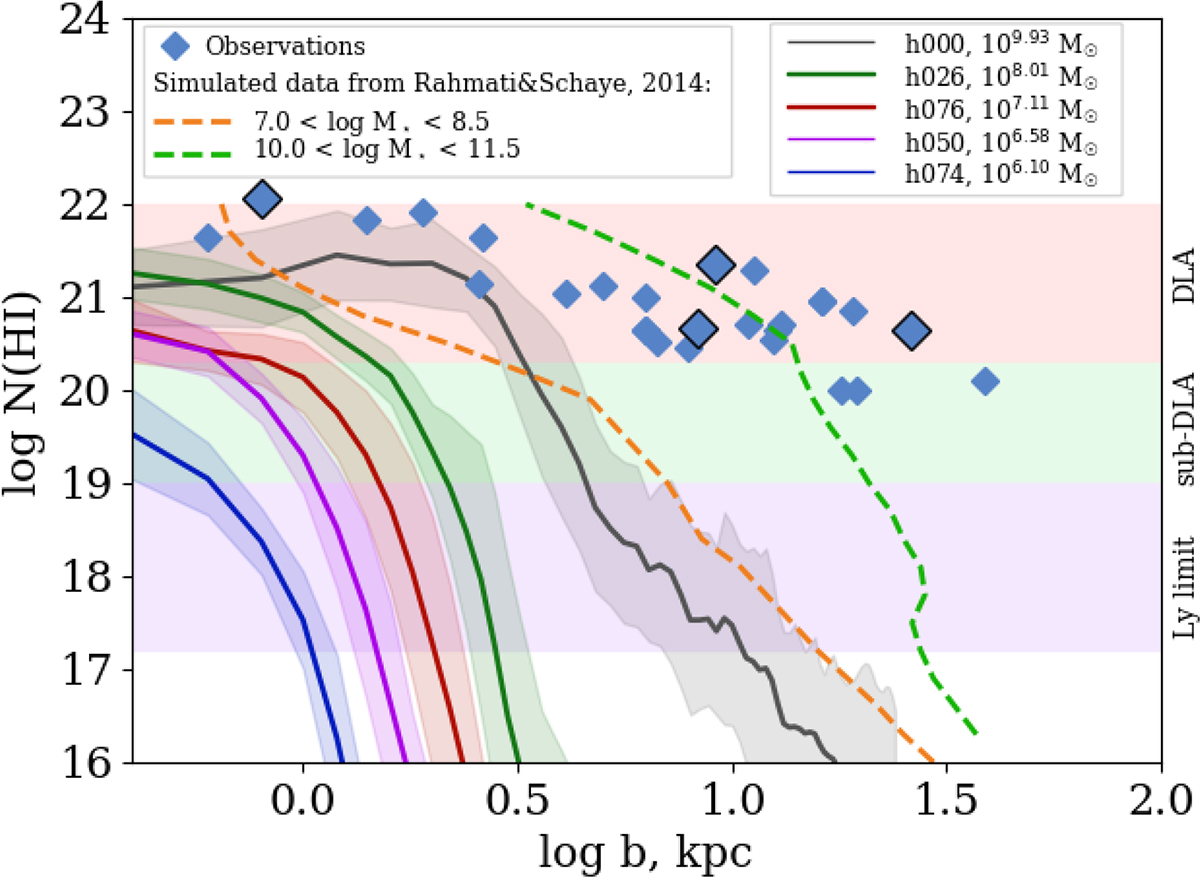
Fig. 4.
Download original image
H I column densities versus impact parameter at z > 1.9. Solid curves and 1σ confidence area correspond to the GEAR simulations (Revaz & Jablonka 2018; Roca-Fàbrega et al. 2021) at z = 2.55 averaged over 18 viewing angles. Blue diamonds show high-z observations from Christensen et al. (2014) and Møller & Christensen (2020), and compilations of observed data by Rahmati & Schaye (2014) and Krogager & Noterdaeme (2020). The highlighted symbols show the objects belonging to the golden sample from Velichko et al. (2024). Dashed curves show the data from hydrodynamical simulations performed with the use of the GADGET-3 code by Rahmati & Schaye (2014) in the stellar mass ranges of 7.0 < log(M★/M⊙) < 8.5 (orange) and 10.0 < log(M★/M⊙) < 11.5 (green). The horizontal colored stripes indicate intervals of the H I column density corresponding to DLA, sub-DLA, and Ly-limit systems (see text for details).
Current usage metrics show cumulative count of Article Views (full-text article views including HTML views, PDF and ePub downloads, according to the available data) and Abstracts Views on Vision4Press platform.
Data correspond to usage on the plateform after 2015. The current usage metrics is available 48-96 hours after online publication and is updated daily on week days.
Initial download of the metrics may take a while.