Fig. 5.
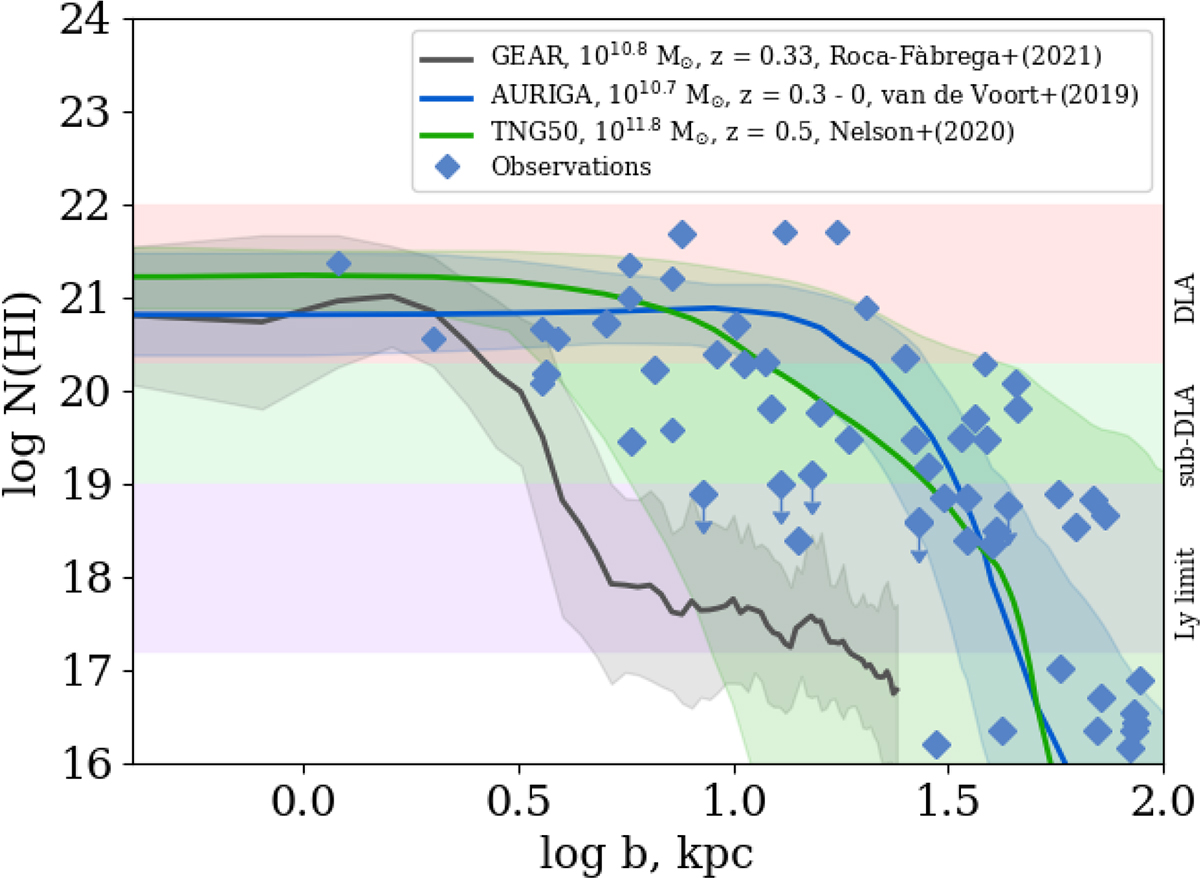
Download original image
H I column densities versus impact parameter at z ∼ 0. Gray curve: the GEAR galaxy h000 (log M★ = 10.8 M⊙ Roca-Fàbrega et al. 2021) taken at z = 0.33. Blue curve: median 2D radial profile of log N(H I) for an AURIGA galaxy at z = 0 − 0.3 with a stellar mass of log M★ = 10.7 M⊙ resimulated by van de Voort et al. (2019). Green curve: Cumulative covering fractions of H I from the TNG50 simulations of a galaxy with log M★ = 11.8 M⊙ (Nelson et al. 2020). The low-z observations taken from Christensen et al. (2014), Møller & Christensen (2020), Kulkarni et al. (2022), Weng et al. (2023), and Berg et al. (2023) are shown by blue diamonds.
Current usage metrics show cumulative count of Article Views (full-text article views including HTML views, PDF and ePub downloads, according to the available data) and Abstracts Views on Vision4Press platform.
Data correspond to usage on the plateform after 2015. The current usage metrics is available 48-96 hours after online publication and is updated daily on week days.
Initial download of the metrics may take a while.