Fig. 6.
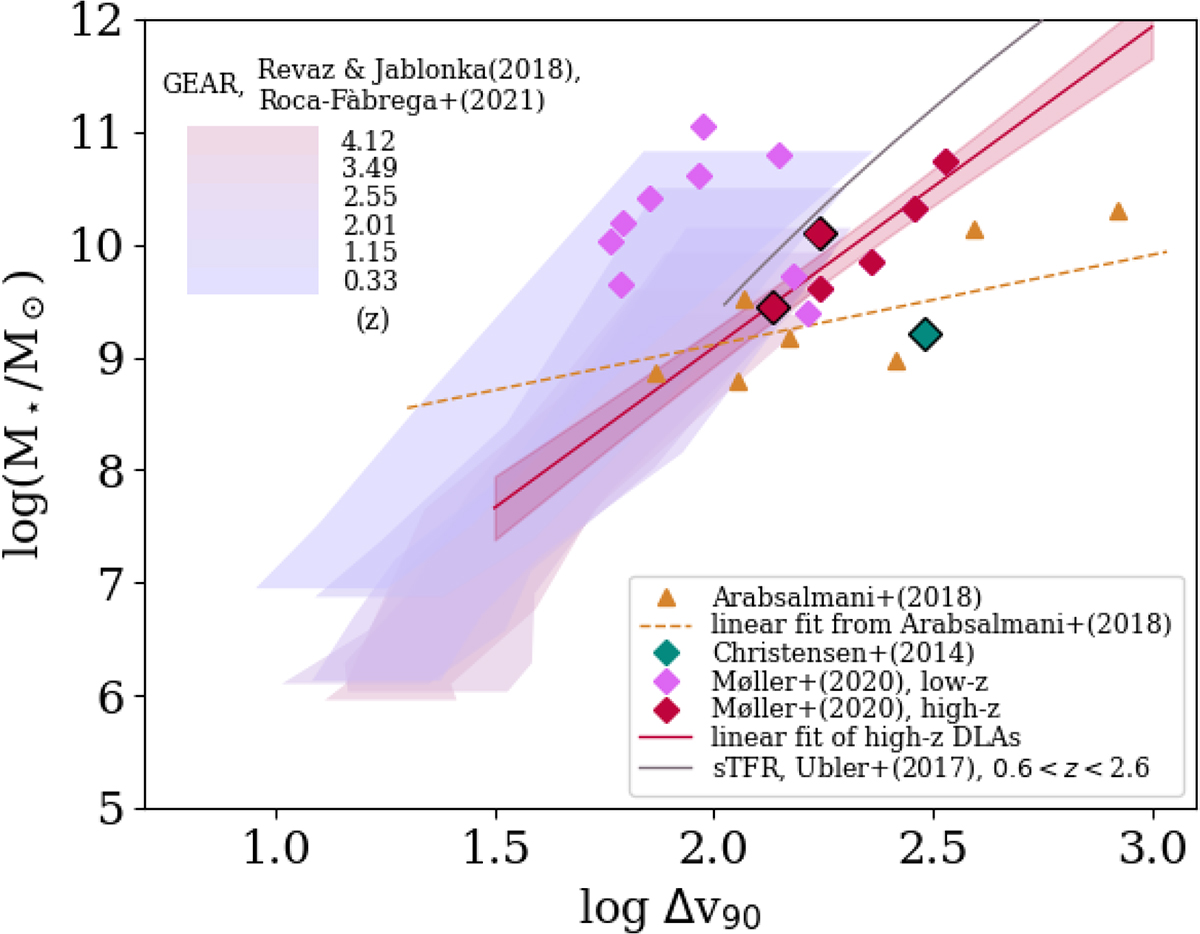
Download original image
Δv90 versus stellar mass. Filled areas correspond to the simulated data from Revaz & Jablonka (2018) and Roca-Fàbrega et al. (2021). Orange triangles show observations of GRBs used by Arabsalmani et al. (2018) to obtain the relation (dashed orange line). The observations of DLAs from Møller & Christensen (2020) are separated into low-z (≤0.1; magenta diamonds) and high-z (> 1.9; red diamonds) galaxies. The turquoise diamond shows observations of Christensen et al. (2014). The highlighted symbols correspond to the sources in the golden sample from Velichko et al. (2024). Red and blue lines with 95% confidence intervals show the linear fitting over high-z DLAs and high-z DLAs + GRBs subsamples, respectively.
Current usage metrics show cumulative count of Article Views (full-text article views including HTML views, PDF and ePub downloads, according to the available data) and Abstracts Views on Vision4Press platform.
Data correspond to usage on the plateform after 2015. The current usage metrics is available 48-96 hours after online publication and is updated daily on week days.
Initial download of the metrics may take a while.