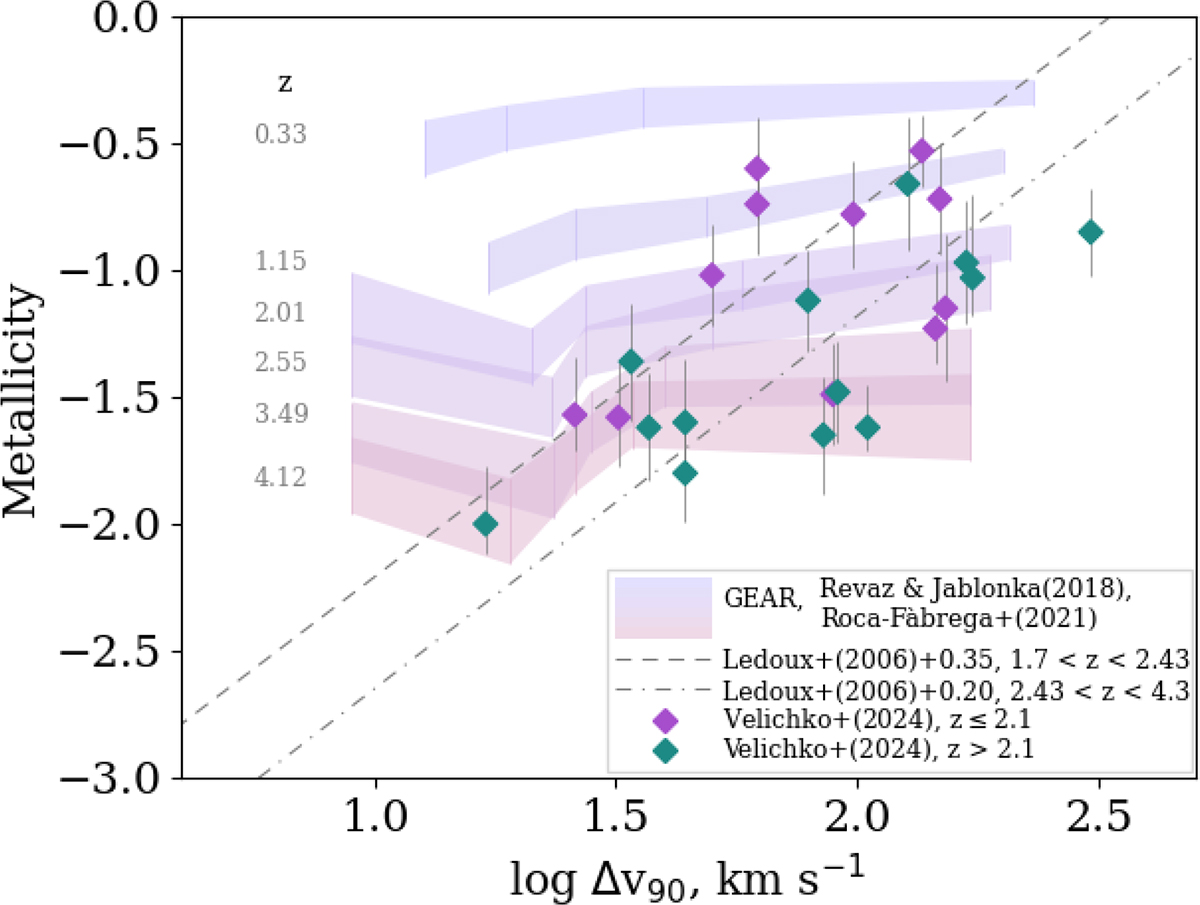
Fig. 7.
Download original image
Velocity widths versus metallicity relation. Shaded area: the simulated data from Revaz & Jablonka (2018) and Roca-Fàbrega et al. (2021) at six redshifts from z = 4.12 to 0.33 (numbers in gray), with vertical lines marking different models. Symbols show the data obtained from observations: total metallicities [M/H]tot corrected for dust depletion by Velichko et al. (2024) and Δv90 found in the literature in the redshift ranges z ≤ 2.1 (violet diamonds) and z > 2 (green diamonds). Gray lines show the best fit of data on 70 DLAs at redshifts of 1.7 < z < 2.43 (dashed line) and 2.43 < z < 4.3 (dash-dotted line) from Ledoux et al. (2006), biased in metallicity by +0.2 and +0.35 dex for the high- and low-z subsamples, respectively, to roughly take into account the dust depletion.
Current usage metrics show cumulative count of Article Views (full-text article views including HTML views, PDF and ePub downloads, according to the available data) and Abstracts Views on Vision4Press platform.
Data correspond to usage on the plateform after 2015. The current usage metrics is available 48-96 hours after online publication and is updated daily on week days.
Initial download of the metrics may take a while.