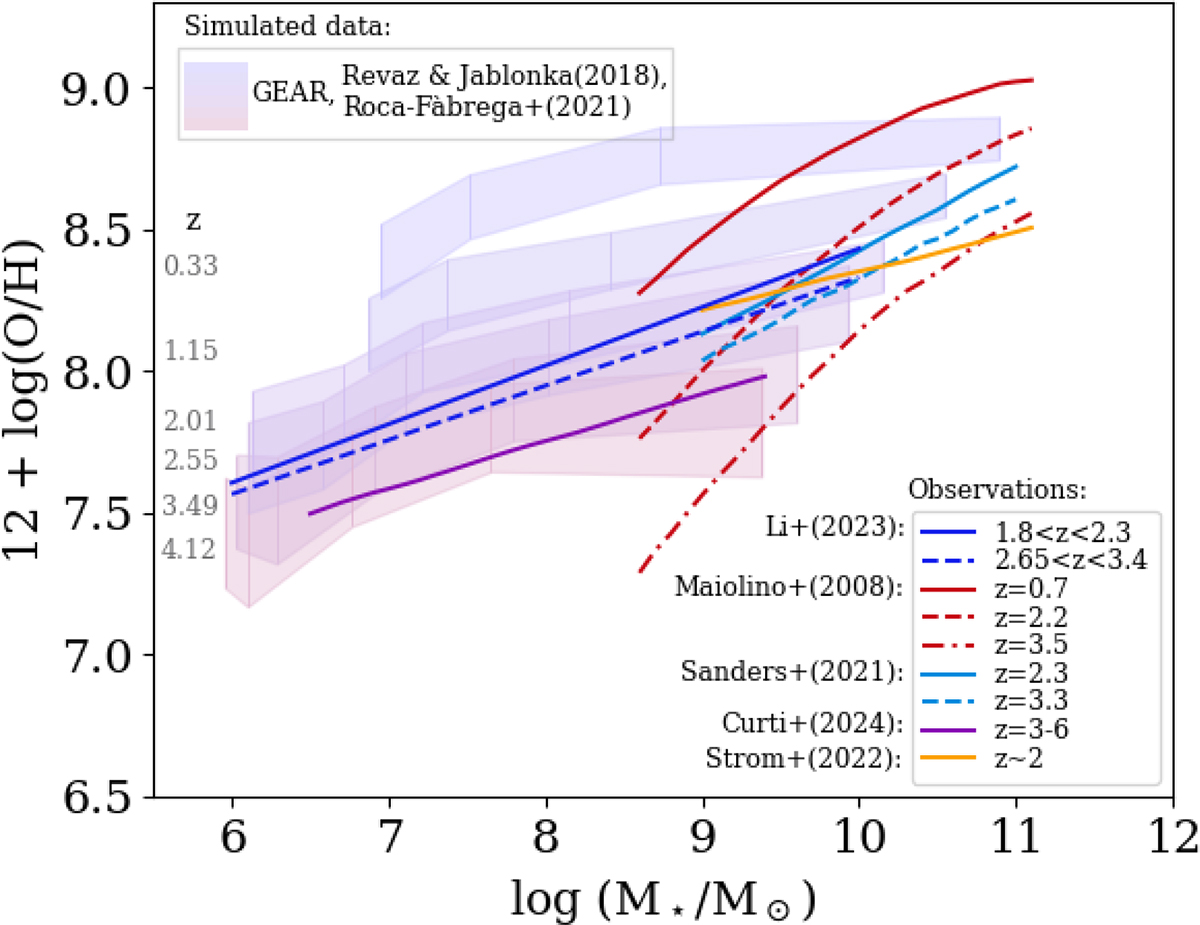
Fig. 8.
Download original image
Mass–metallicity relation using 12+log(O/H) as the metallicity tracer. Shaded bands: Simulated data with 1σ confidence intervals (Revaz & Jablonka 2018; Roca-Fàbrega et al. 2021) at redshifts marked by the numbers in gray. The curves present the observed MZR obtained in the literature. Dark blue: Li et al. (2023) values from the study of dwarf galaxies at 1.8 < z < 2.3 and 2.65 < z < 3.4 with JWST/NIRISS. Red: Maiolino et al. (2008) values found by reprocessing the data from Tremonti et al. (2004), Kewley & Ellison (2008), Savaglio et al. (2005), and Erb et al. (2006) at 0.1 < z < 2.2; as well as from the VLT near-IR observations performed with SINFONI at redshifts of 3 < z < 5. Blue: Sanders et al. (2021) values from the MOSDEF survey of galaxies at z ∼ 2.3 and 3.3. Purple: Curti et al. (2024) values from the analysis of low-mass galaxies at 3 < z < 6 observed with JWST/NIRSpec. Orange: Strom et al. (2022) values from a sample of 195 star-forming galaxies at z ∼ 2 from the Keck Baryonic Structure Survey.
Current usage metrics show cumulative count of Article Views (full-text article views including HTML views, PDF and ePub downloads, according to the available data) and Abstracts Views on Vision4Press platform.
Data correspond to usage on the plateform after 2015. The current usage metrics is available 48-96 hours after online publication and is updated daily on week days.
Initial download of the metrics may take a while.