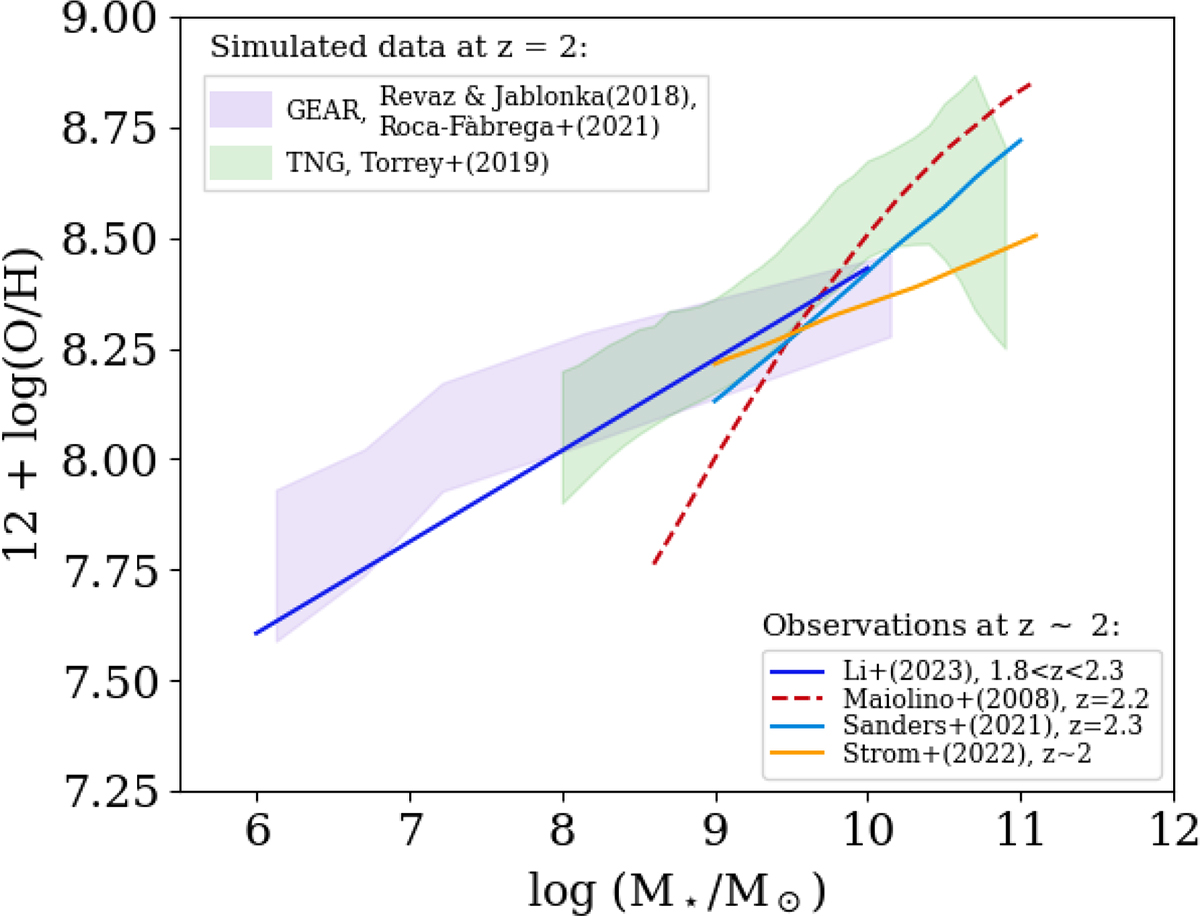
Fig. 9.
Download original image
Mass–metallicity relation at z ∼ 2. Blue shaded area: Simulated data from Revaz & Jablonka (2018) and Roca-Fàbrega et al. (2021) at z = 2.01. Green shaded area: MZR obtained by Torrey et al. (2019) from the TNG simulations at z = 2. The colored curves present the observed MZR obtained in the literature at z ∼ 2 (the same line styles as in Fig. 8).
Current usage metrics show cumulative count of Article Views (full-text article views including HTML views, PDF and ePub downloads, according to the available data) and Abstracts Views on Vision4Press platform.
Data correspond to usage on the plateform after 2015. The current usage metrics is available 48-96 hours after online publication and is updated daily on week days.
Initial download of the metrics may take a while.