Fig. 1.
Download original image
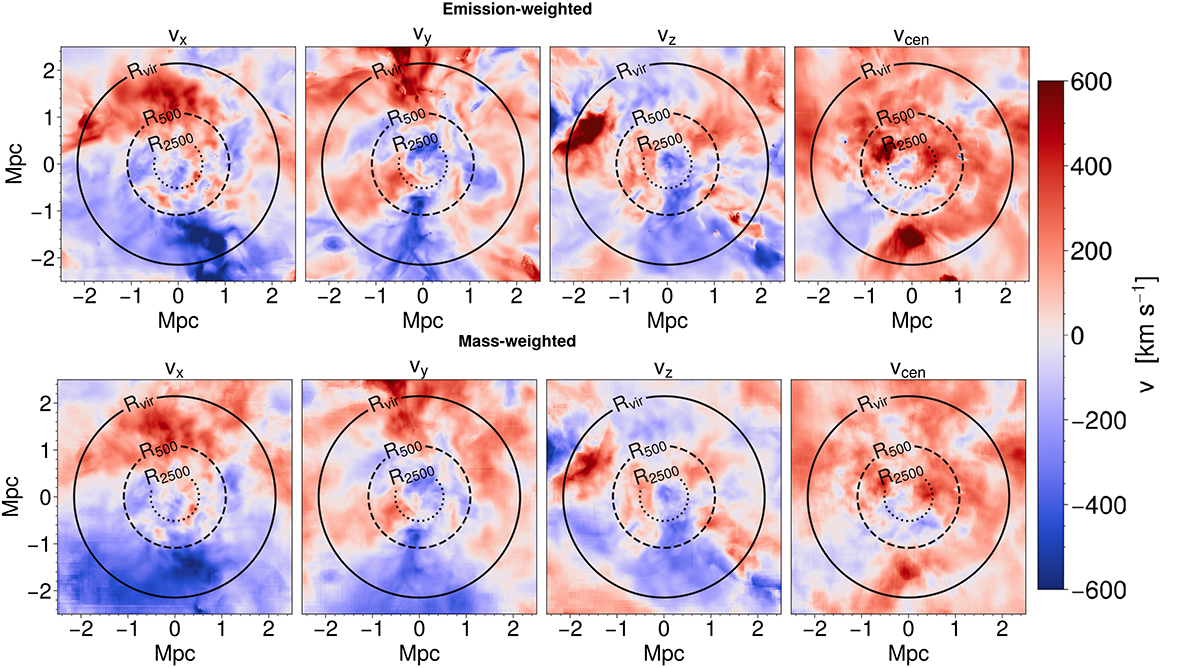
Projections of the velocity integrated along the vx, vy, vz and vcen sightlines from left to right. The top (bottom) row presents the EW (MW) maps. The solid, dashed and dotted black circles respectively represent Rvir, R500 and R2500. The colour bar goes from −600 km s−1 (blue), meaning an average gas flow coming from the foreground of Virgo and going away from the observer, to 600 km s−1 (red), meaning, inversely, an average gas flow coming from the background of Virgo and coming toward the observer.
Current usage metrics show cumulative count of Article Views (full-text article views including HTML views, PDF and ePub downloads, according to the available data) and Abstracts Views on Vision4Press platform.
Data correspond to usage on the plateform after 2015. The current usage metrics is available 48-96 hours after online publication and is updated daily on week days.
Initial download of the metrics may take a while.