Fig. 2.
Download original image
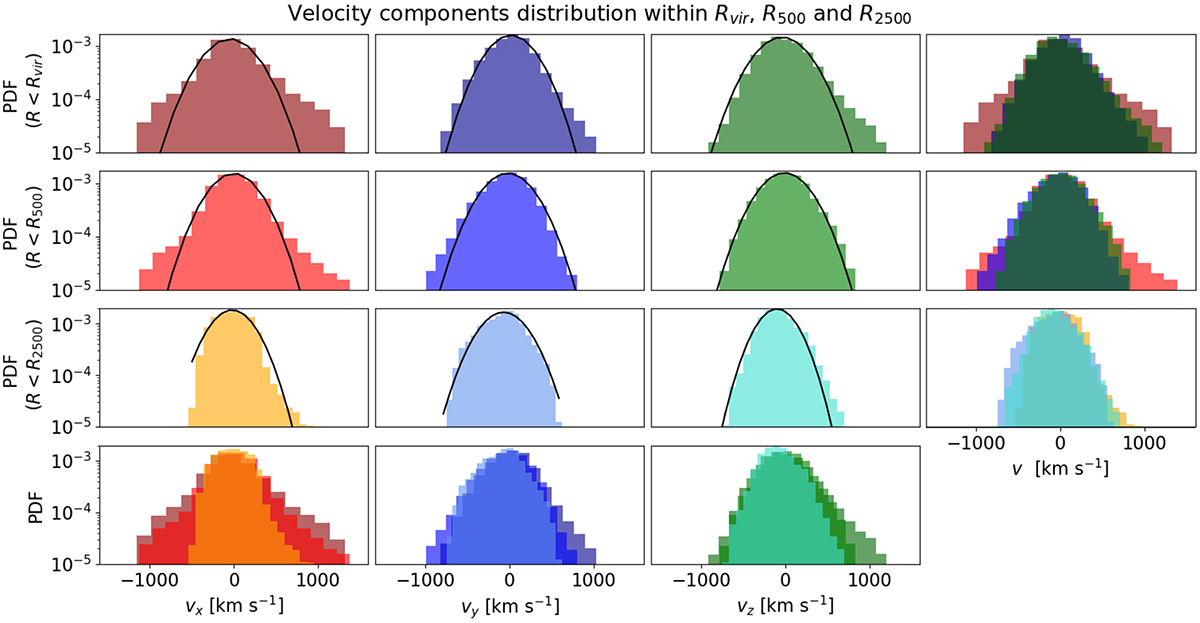
PDFs of the three components of the velocity field within Rvir = 2147 kpc, R500 = 1087 kpc, and R2500 = 515 kpc. The first three rows display the PDFs computed within spheres of decreasing radius from top to bottom. The first three columns display the PDF of each component of the velocity field, vx, from red to yellow, vy in shades of blue, and vz in shades of green, from left to right. The right column overlays the PDFs of the three velocity-field components in a given sphere, and the bottom row overlays the PDFs of a given velocity-field component inside the different spheres. Fitted Gaussian envelopes are displayed as solid black curves. The statistical moments of the PDFs and the best-fit values of the Gaussian fit can be found in Table C.1.
Current usage metrics show cumulative count of Article Views (full-text article views including HTML views, PDF and ePub downloads, according to the available data) and Abstracts Views on Vision4Press platform.
Data correspond to usage on the plateform after 2015. The current usage metrics is available 48-96 hours after online publication and is updated daily on week days.
Initial download of the metrics may take a while.