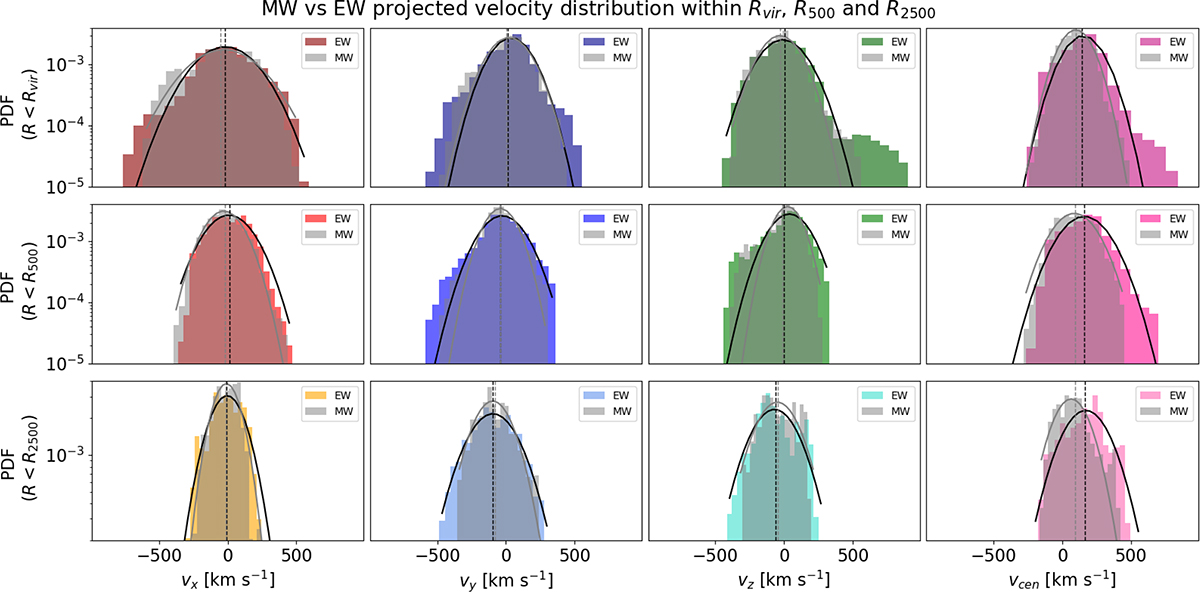
Fig. 3.
Download original image
2D PDFs of EW and MW maps computed within circles of the radii Rvir, R500, and R2500 from top to bottom, for the vx, vy, vz, and vcen projected velocities from left to right. The PDFs extracted from the EW maps are displayed following the same colour-code as Fig. 2. The fitted Gaussian envelope is also shown as a solid black curve, and a vertical dashed black line represents the mean of the PDF. In addition, the PDFs extracted from the MW maps, their fitted Gaussian envelope, and their mean are overlaid in grey in the same style as their EW counterpart.
Current usage metrics show cumulative count of Article Views (full-text article views including HTML views, PDF and ePub downloads, according to the available data) and Abstracts Views on Vision4Press platform.
Data correspond to usage on the plateform after 2015. The current usage metrics is available 48-96 hours after online publication and is updated daily on week days.
Initial download of the metrics may take a while.