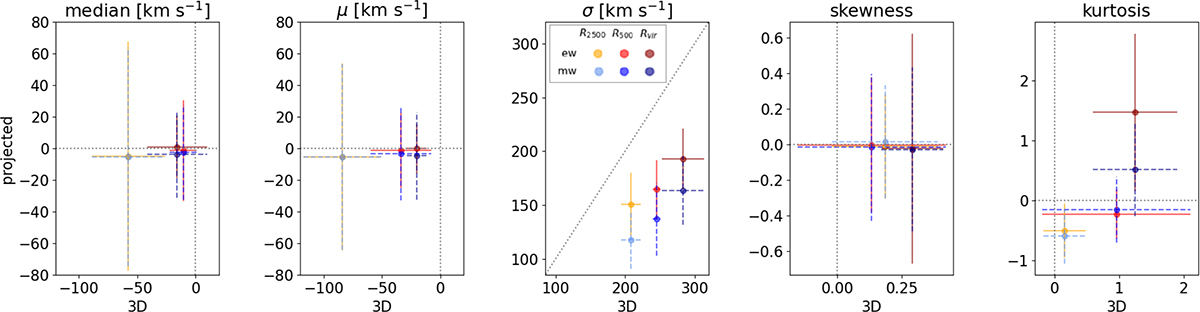
Fig. 4.
Download original image
Comparison of statistical properties of the 3D velocity field (x-axis) over projected sightline velocities (y-axis). We show the mean value and the standard deviation among the three components of the 3D velocity field, i.e. vx, vy, vz, in the x-axis, and among 100 random projections in the y-axis. From left to right, we present the median, the mean, the standard deviation (≡σproj in the top panel of Fig. 5), the skewness, and the kurtosis. We display the quantities estimated from EW (MW) projections within R2500 in orange (cyan), R500 in red (blue), and Rvir in dark red (dark blue). The legend can be found in the central panel.
Current usage metrics show cumulative count of Article Views (full-text article views including HTML views, PDF and ePub downloads, according to the available data) and Abstracts Views on Vision4Press platform.
Data correspond to usage on the plateform after 2015. The current usage metrics is available 48-96 hours after online publication and is updated daily on week days.
Initial download of the metrics may take a while.