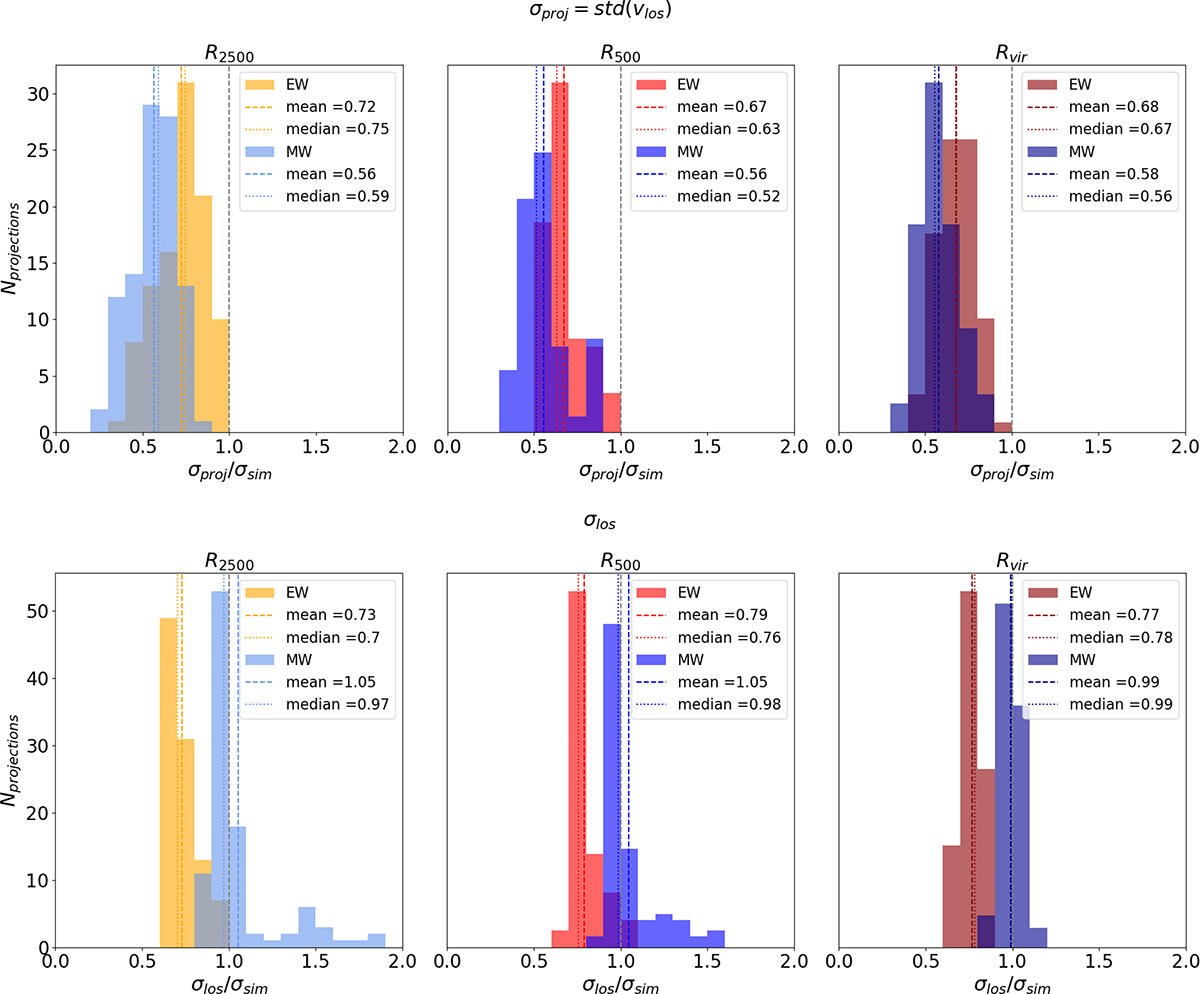
Fig. 5.
Download original image
Histograms of the ratio of the standard deviationof sightline velocity (σproj, top, already presented in central panel of Fig. 4, std stands for standard deviation) and sightline velocity dispersions (σlos, bottom) of one hundred random projections over the 1D velocity dispersion of the 3D velocity field, σsim2 = (σx2 + σy2 + σz2)/3. For each row, we present the ratio of the quantities estimated within R2500 in orange for the EW projections (cyan for MW), R500 in red for the EW projections (blue for MW) and Rvir in dark red for the EW projections (dark blue for MW). The mean (median) of the distributions is displayed as dashed (dotted) vertical lines in the same colours and can be compared to one displayed as a dashed grey vertical line.
Current usage metrics show cumulative count of Article Views (full-text article views including HTML views, PDF and ePub downloads, according to the available data) and Abstracts Views on Vision4Press platform.
Data correspond to usage on the plateform after 2015. The current usage metrics is available 48-96 hours after online publication and is updated daily on week days.
Initial download of the metrics may take a while.