Open Access
Fig. 6.
Download original image
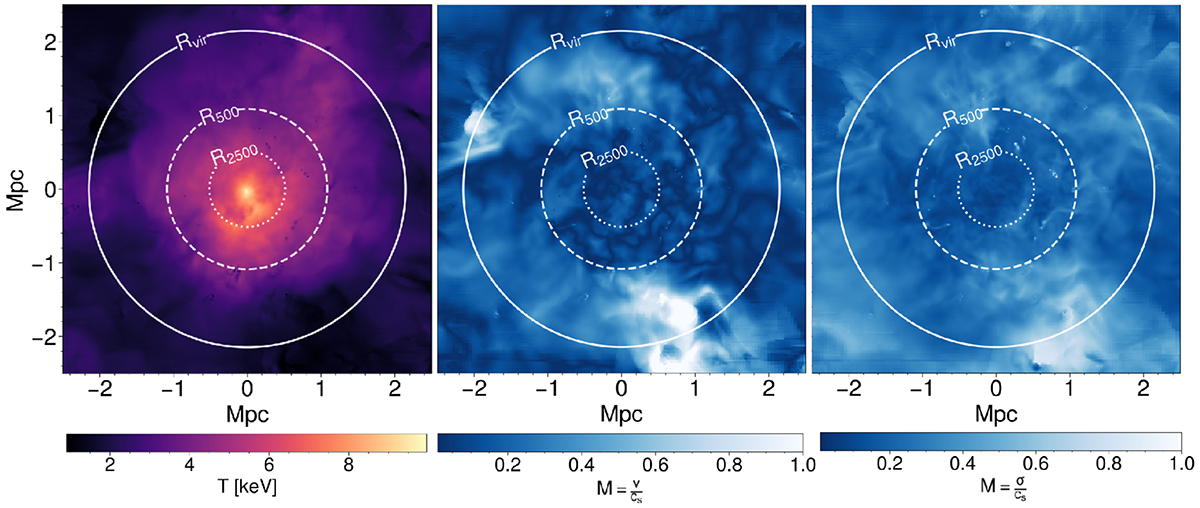
Projected spectroscopic-like temperature (left) and the ratio of the EW sightline velocity (centre) and velocity dispersion (right) over the sound speed in each pixel, which is thus a local Mach number, along the x sightline. The solid, dashed and dotted white circles respectively represent Rvir, R500 and R2500.
Current usage metrics show cumulative count of Article Views (full-text article views including HTML views, PDF and ePub downloads, according to the available data) and Abstracts Views on Vision4Press platform.
Data correspond to usage on the plateform after 2015. The current usage metrics is available 48-96 hours after online publication and is updated daily on week days.
Initial download of the metrics may take a while.