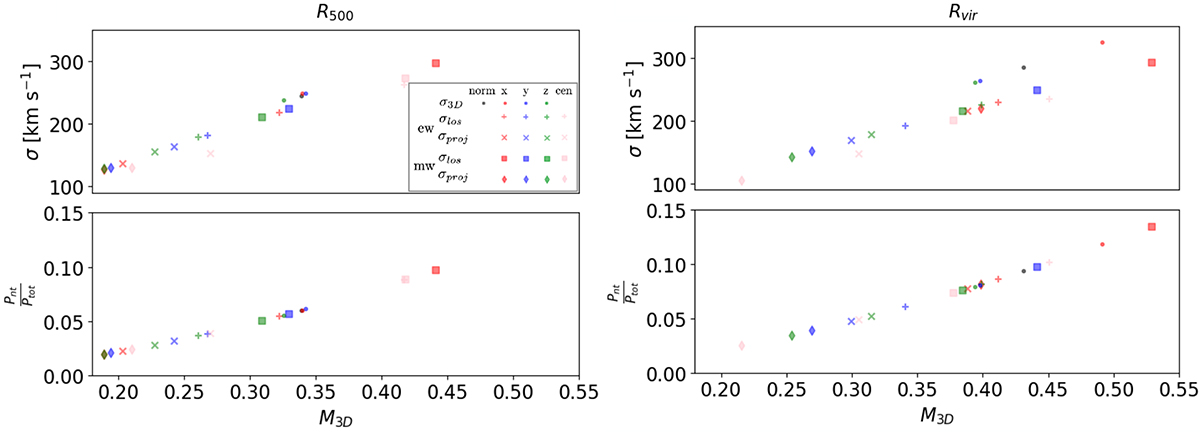
Fig. 7.
Download original image
Mach number (x-axis) compared to the velocity dispersion, σ, (top) and the non-thermal pressure fraction (bottom). The left (right) panel presents the quantities computed within R500 (Rvir). Each marker represents a method to compute the velocity dispersion: dots for the 3D, ‘plus’ (square) for the sightline velocity dispersion and cross (diamond) for the standard deviation over the sightline velocity, both from EW (MW) projections. The values derived from the norm of the 3D velocity field are displayed in black. The quantities derived from the x, y, z, and cen components (indeed only x, y, z) or projections are respectively displayed in red, blue, green and pink.
Current usage metrics show cumulative count of Article Views (full-text article views including HTML views, PDF and ePub downloads, according to the available data) and Abstracts Views on Vision4Press platform.
Data correspond to usage on the plateform after 2015. The current usage metrics is available 48-96 hours after online publication and is updated daily on week days.
Initial download of the metrics may take a while.