Fig. 8.
Download original image
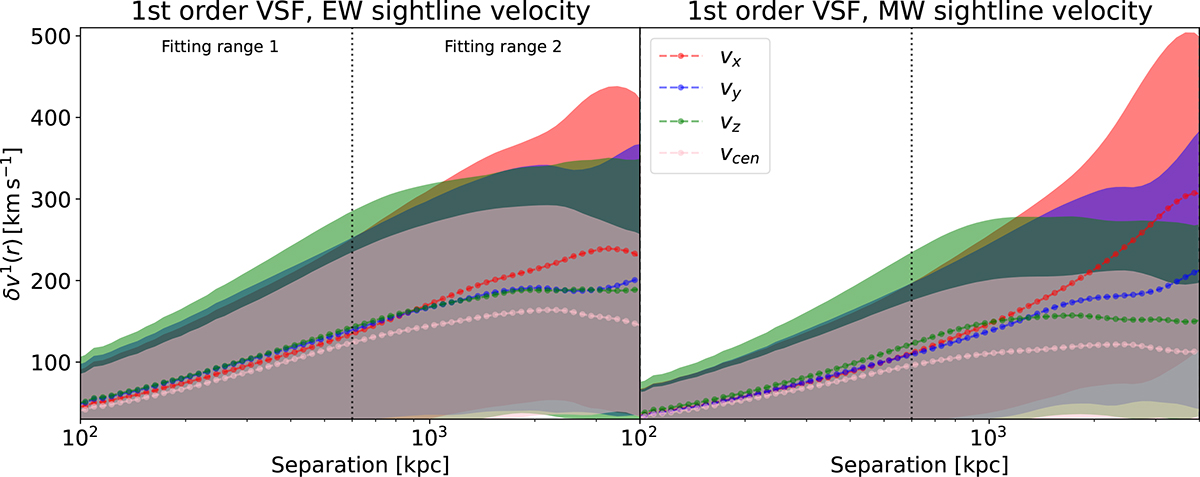
First order velocity structure function (VSF) computed from EW (left) and MW projected maps (right). They are displayed in red for the vx projection, blue for the vy projection, green for the vz projection and pink for the vcen projection. The dispersions are displayed in shaded areas in the same colours. They are presented in the [100, 4000] kpc range, considered as the range of validity of the study (see left panel of Fig. B.1). The range is separated into two fitting ranges: [100, 600] kpc and [600, 1000] kpc, separated by a dashed vertical dotted black line on the plot. The best-fit slope values in each interval are reported in Table 1.
Current usage metrics show cumulative count of Article Views (full-text article views including HTML views, PDF and ePub downloads, according to the available data) and Abstracts Views on Vision4Press platform.
Data correspond to usage on the plateform after 2015. The current usage metrics is available 48-96 hours after online publication and is updated daily on week days.
Initial download of the metrics may take a while.