Fig. 9.
Download original image
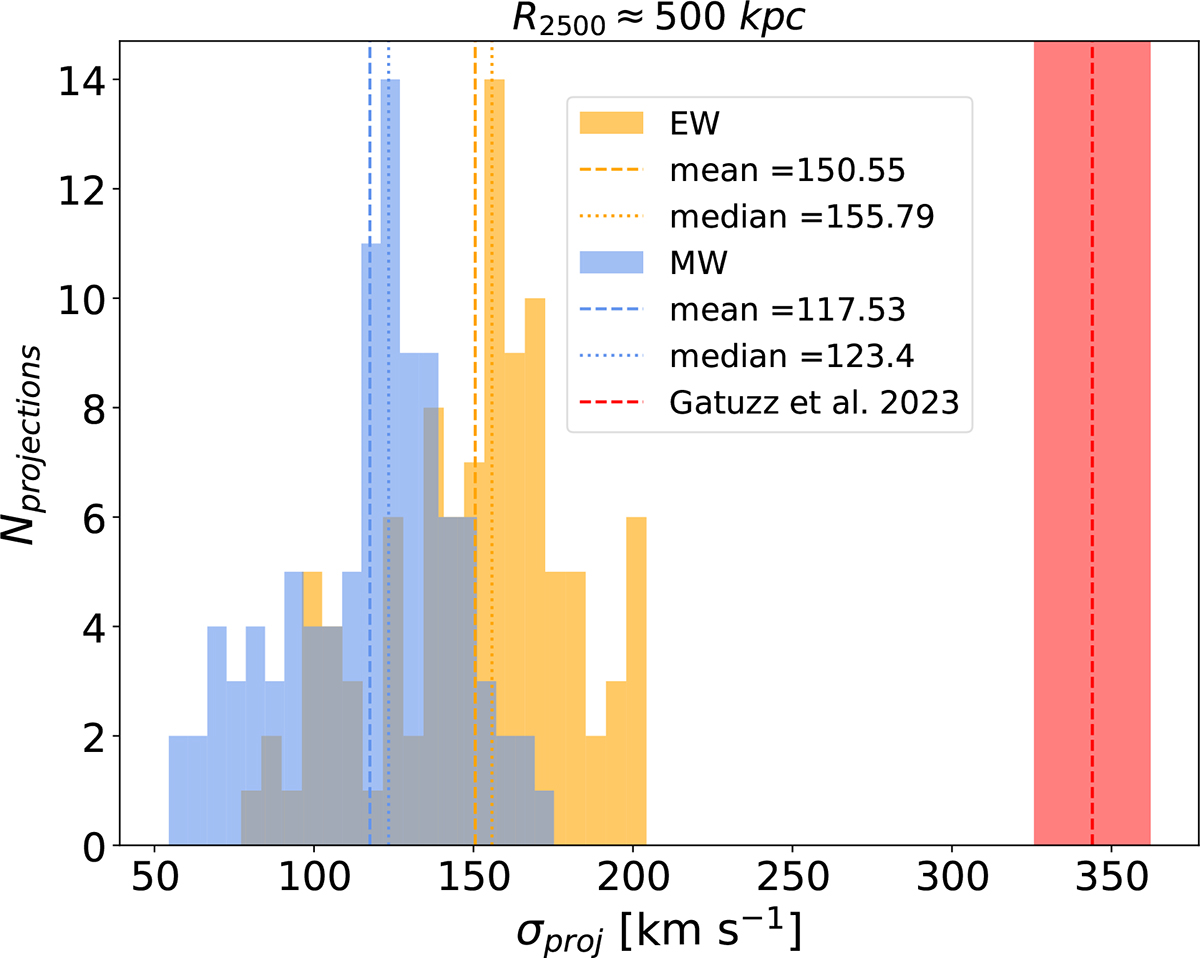
Comparison between σproj of the hundred randomly oriented projections within R2500, as already presented in top left panel of Fig. 5 this time not divided by σsim, and the best-fit value of the standard deviation found in Gatuzz et al. (2023a) displayed as a red dashed vertical line within a shaded area representing the uncertainty.
Current usage metrics show cumulative count of Article Views (full-text article views including HTML views, PDF and ePub downloads, according to the available data) and Abstracts Views on Vision4Press platform.
Data correspond to usage on the plateform after 2015. The current usage metrics is available 48-96 hours after online publication and is updated daily on week days.
Initial download of the metrics may take a while.