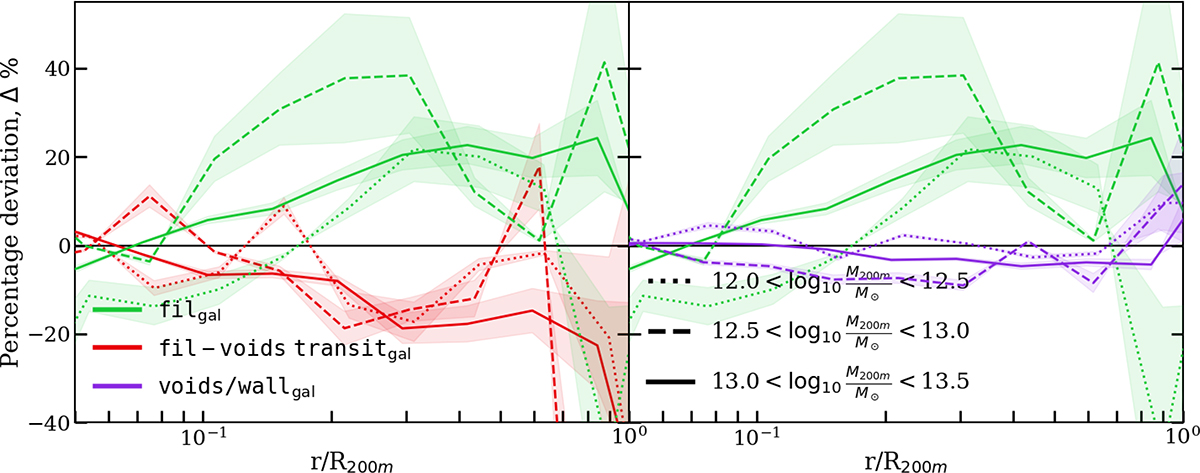
Fig. 4.
Download original image
Percentage deviations of the XSB profiles of halos located in filaments (green), compared to those in the filament-void transition region (left panel: red lines) and in voids and walls (right: purple lines). We also show the effect of varying the halo-mass bins, where the dotted lines represent the M200 m ∈ 1012 − 12.5 M⊙ halos, whereas the dashed and solid lines represent the M200 m ∈ 1012.5 − 13 M⊙ and M200 m ∈ 1013 − 13.5 M⊙ bins, respectively. We find that the XSB profiles of filgal are X-ray brighter in ∼(0.3 − 0.5)×R200 m by 20 − 45% with respect to the fil-voids transitgal and voids+wallgal populations.
Current usage metrics show cumulative count of Article Views (full-text article views including HTML views, PDF and ePub downloads, according to the available data) and Abstracts Views on Vision4Press platform.
Data correspond to usage on the plateform after 2015. The current usage metrics is available 48-96 hours after online publication and is updated daily on week days.
Initial download of the metrics may take a while.