Fig. 6.
Download original image
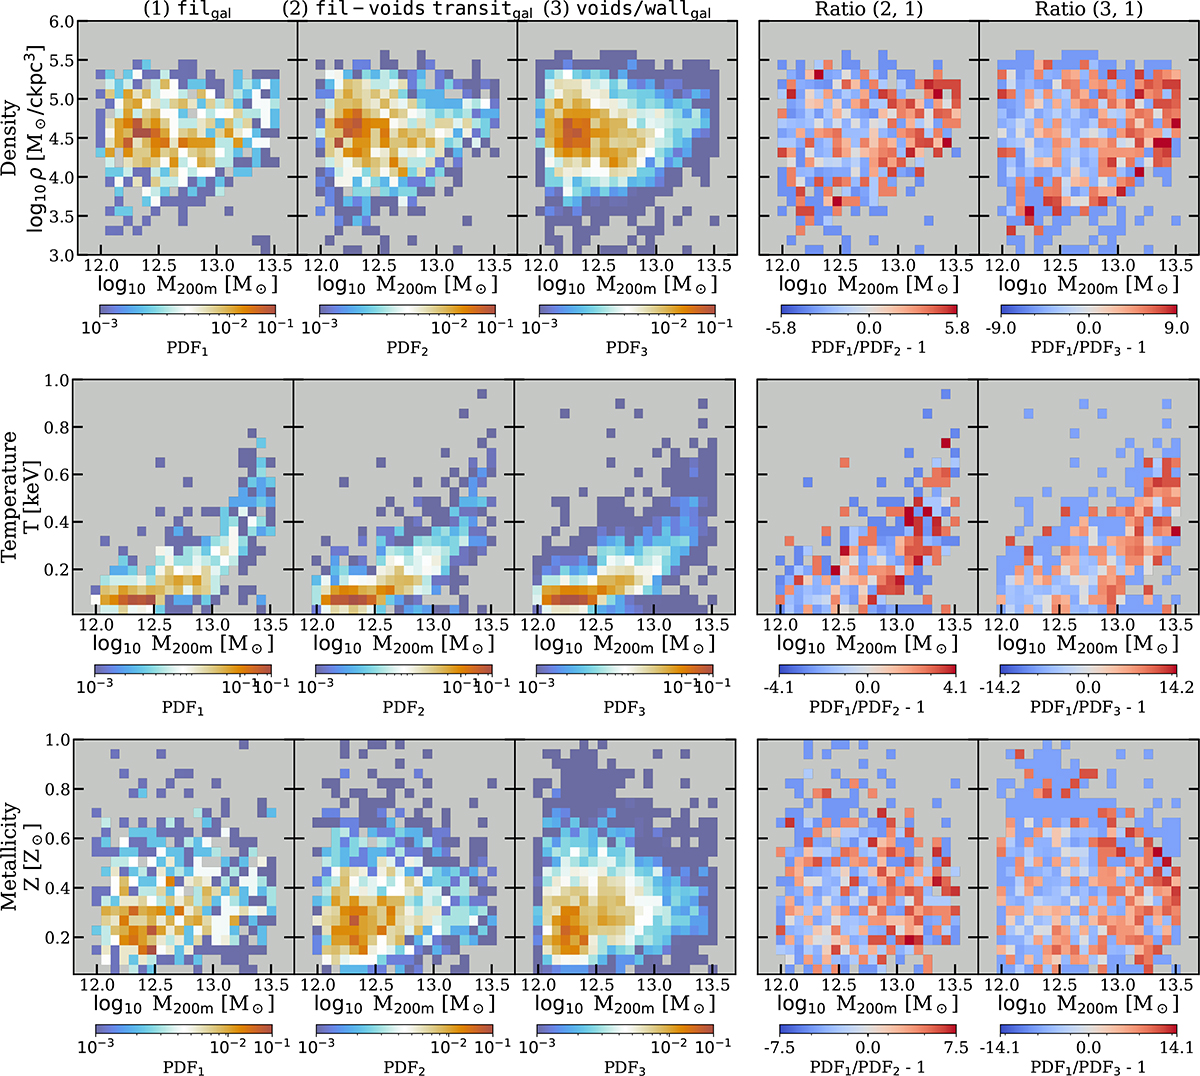
Normalized probability distribution functions of gas mass density, ρ (top row), temperature, T (middle row), and metallicity, Zmet (bottom row), as a function of the halo mass. The population of galaxies in filaments (1825), filament-void transition region (3434), and voids and walls (10 183) is shown in the first three columns, respectively. The last two columns show the ratios of the fil-voids transitgal and the voids+wallgal to the filgal population. The colour bars in the ratio panels indicate the relative suppression (blue) or enhancement (red) of the thermodynamic quantity of the filament galaxies with respect to transition or galaxy voids and walls. We find that the overdense intrafilamentary environments hosting the filgal population show up to a factor of 9× higher gas densities, 14× higher temperatures, and 14× higher metallicities compared to the void and wall populations.
Current usage metrics show cumulative count of Article Views (full-text article views including HTML views, PDF and ePub downloads, according to the available data) and Abstracts Views on Vision4Press platform.
Data correspond to usage on the plateform after 2015. The current usage metrics is available 48-96 hours after online publication and is updated daily on week days.
Initial download of the metrics may take a while.