Fig. 9
Download original image
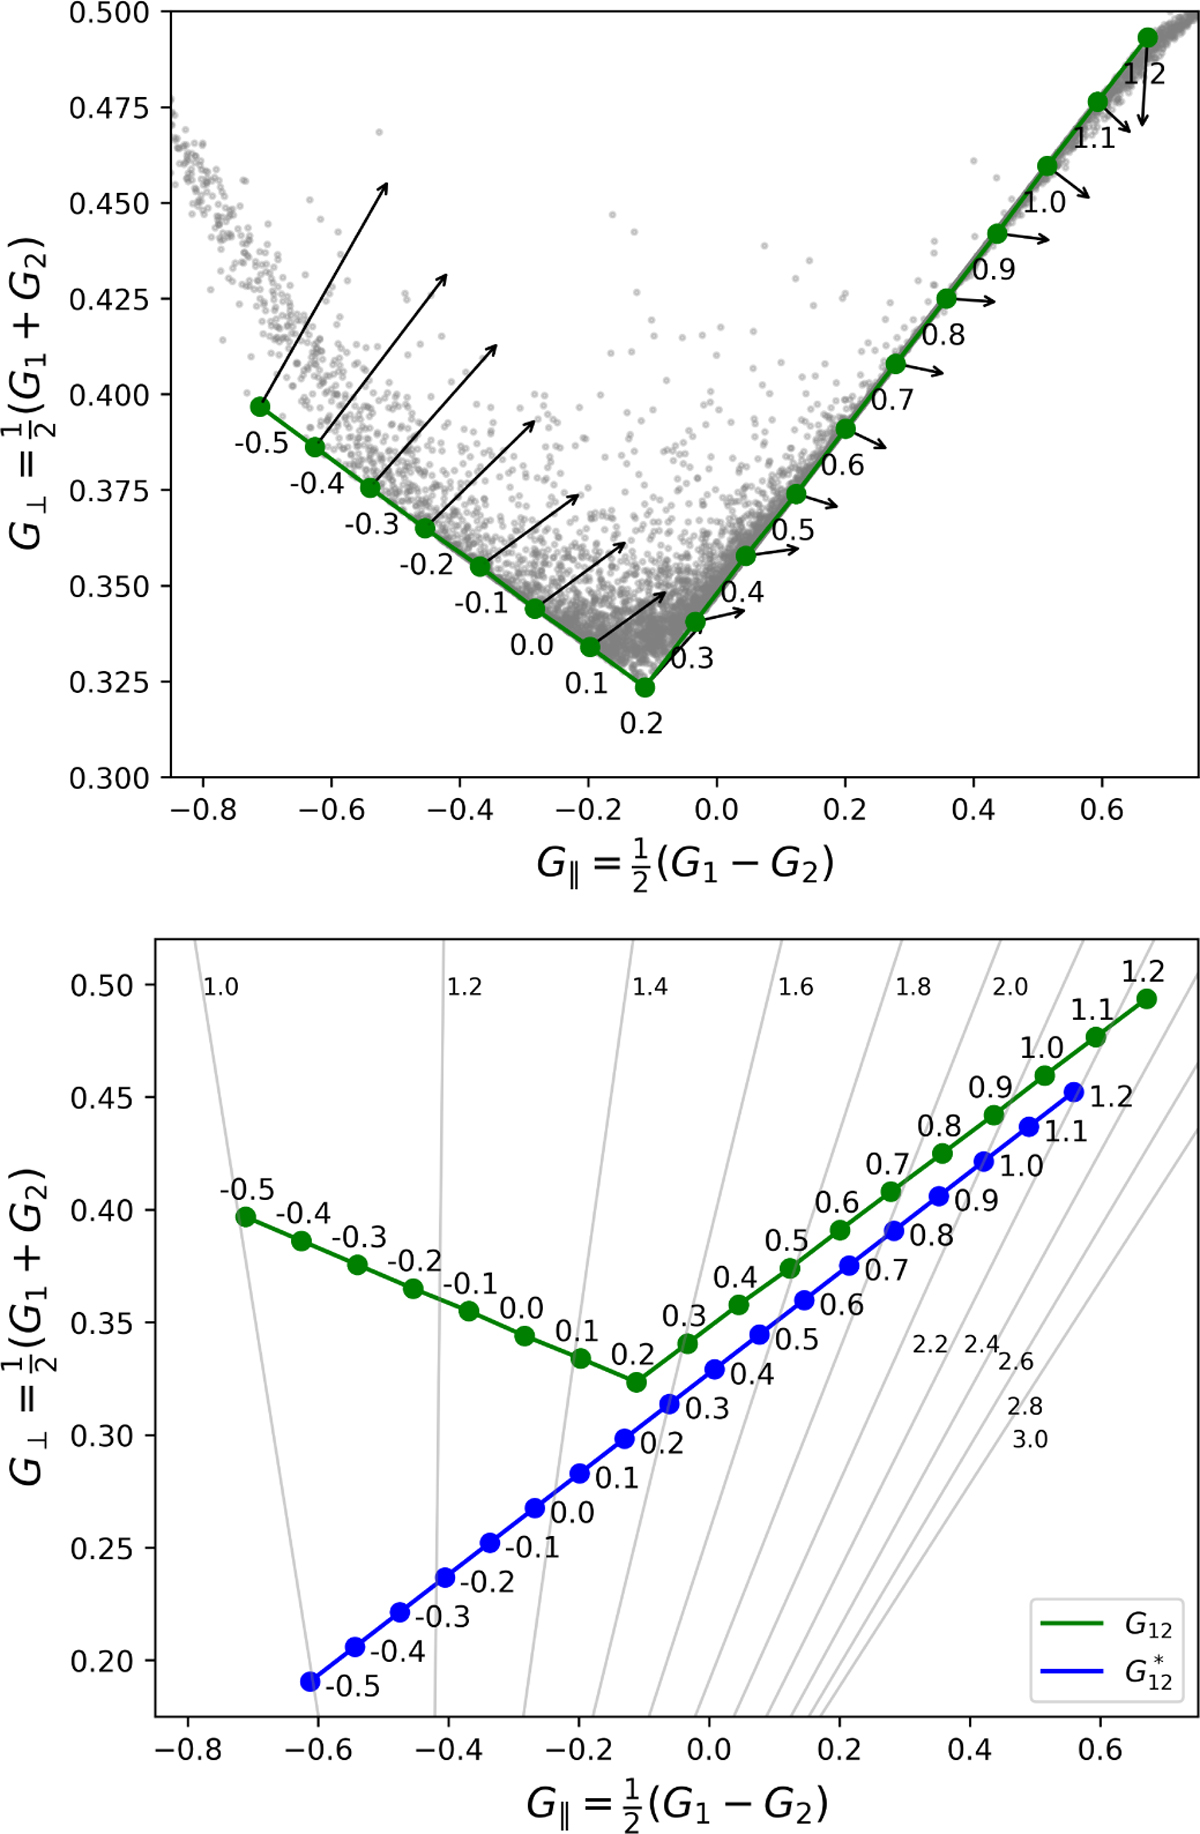
G⊥ versus G|| green line shows the G12 relationship with marked values. Top : objects in our dataset calculated from G1 and G2 derived from H,G12 fits. Arrows extending from the G12 relationship indicate the approximate corresponding shift when LC maxima are used. Bottom : the gray lines show the photometric slopes (β0) from 1.0 to 3.0 mag/rad in 0.2 increments. The theoretical G12 relationship is shown as the blue line.
Current usage metrics show cumulative count of Article Views (full-text article views including HTML views, PDF and ePub downloads, according to the available data) and Abstracts Views on Vision4Press platform.
Data correspond to usage on the plateform after 2015. The current usage metrics is available 48-96 hours after online publication and is updated daily on week days.
Initial download of the metrics may take a while.