Fig. 5.
Download original image
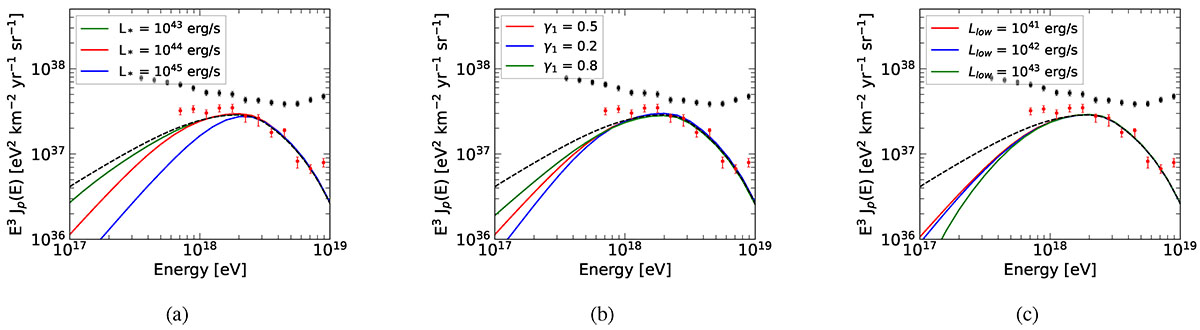
Cosmic-ray intensity at Earth. Panel a: Different positioning of ℒ*, with γ1 = 0.5. Panel b: Different slope, with the positioning of the break fixed at ℒ* = 1044 erg/s. Panel c: Different choices of ℒlow, with ℒ* = 1044 erg/s and γ1 = 0.5. γ2 = 2.5 in all the cases. The all-particle spectrum (Abreu et al. 2021; Aab et al. 2020) measured by Auger and the proton fraction (Aab et al. 2014a,b, 2016) inferred through the EPOS-LHC hadronic interaction model (Pierog et al. 2015) are shown with black squares and red circles, respectively. As a comparison, the same result is shown for an injection Qsrc(E)∝E−2 (dashed black).
Current usage metrics show cumulative count of Article Views (full-text article views including HTML views, PDF and ePub downloads, according to the available data) and Abstracts Views on Vision4Press platform.
Data correspond to usage on the plateform after 2015. The current usage metrics is available 48-96 hours after online publication and is updated daily on week days.
Initial download of the metrics may take a while.