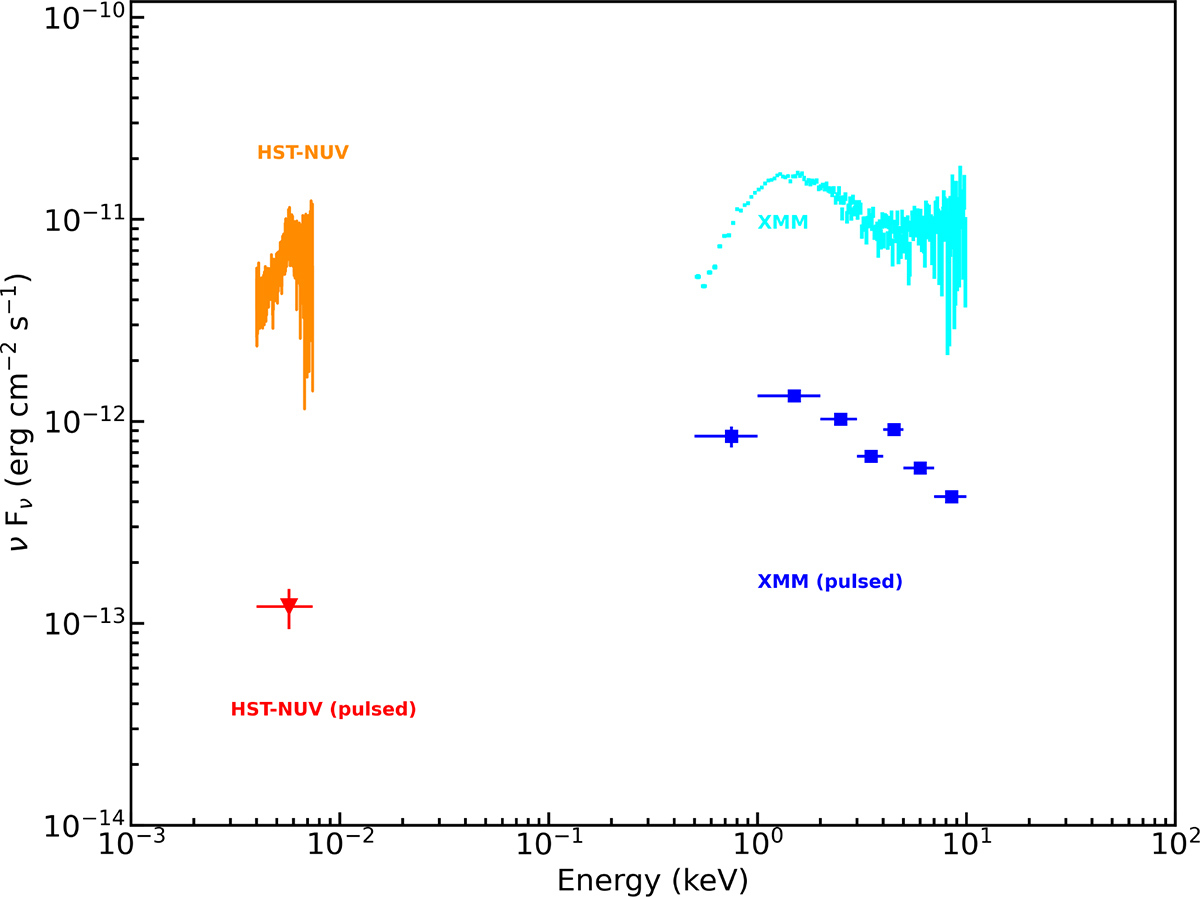
Fig. 12.
Download original image
Unabsorbed SED of SAX J1808 from UV to X-rays obtained using simultaneous XMM-Newton/HST (STIS) observations performed during the 2022 outburst reflare phase (September 10, 2022). The HST spectrum is shown in orange from 165 to 310 nm. The pulsed UV flux is plotted with a red triangle. The total 0.5–10 keV X-ray fluxes observed by XMM-Newton are plotted using light blue points. The pulsed X-ray fluxes, plotted as dark blue squares, are calculated over the 0.5–1, 1–2, 2–3, 3–4, 4–5, 5–7, and 7–10 keV energy bands.
Current usage metrics show cumulative count of Article Views (full-text article views including HTML views, PDF and ePub downloads, according to the available data) and Abstracts Views on Vision4Press platform.
Data correspond to usage on the plateform after 2015. The current usage metrics is available 48-96 hours after online publication and is updated daily on week days.
Initial download of the metrics may take a while.