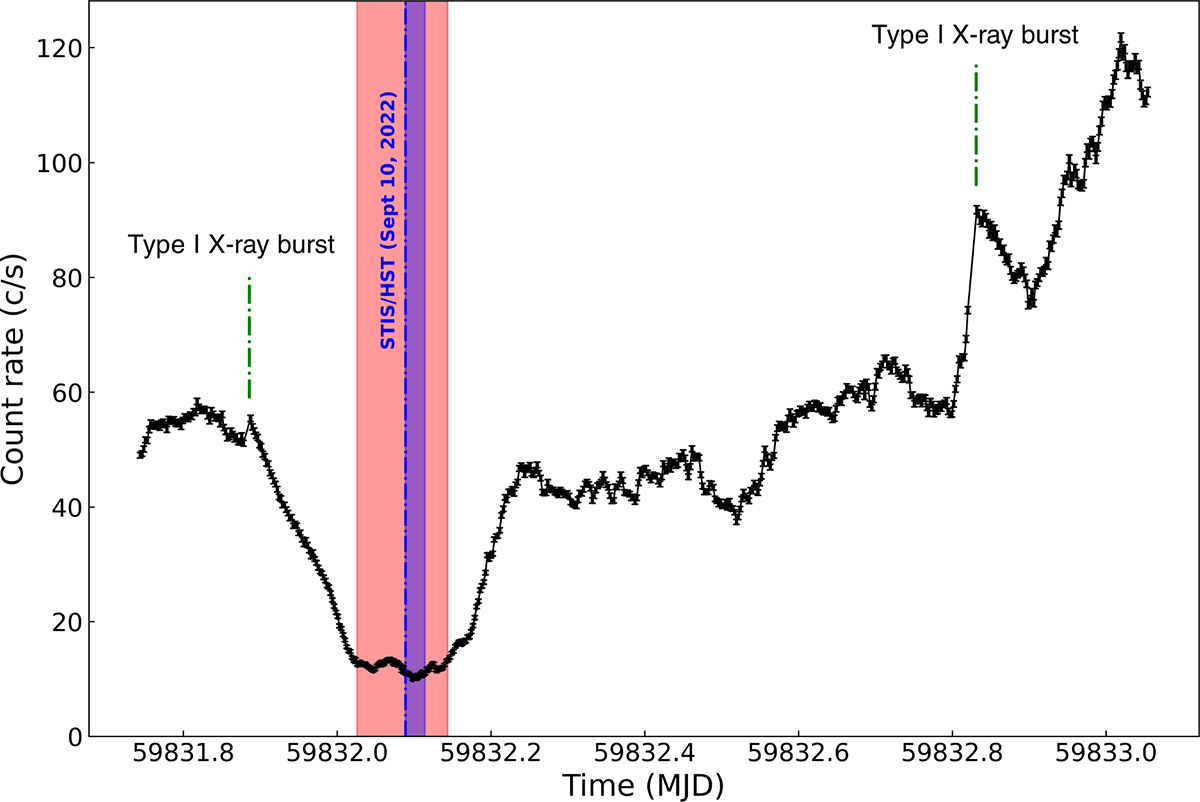
Fig. 2.
Download original image
Background-subtracted 0.5–10 keV XMM-Newton/EPIC-pn light curve of 2022 outburst of SAX J1808 measured using 200 s-long bins. A red band indicates the low-flux interval, and a blue band shows the interval of the HST observation discussed in this paper (see Sect. 3.2 for details). Two Type I X-ray bursts, detected at 59831.87 and 59832.82 MJD, are not plotted. Green dash-dotted lines indicate the epochs of their occurrence.
Current usage metrics show cumulative count of Article Views (full-text article views including HTML views, PDF and ePub downloads, according to the available data) and Abstracts Views on Vision4Press platform.
Data correspond to usage on the plateform after 2015. The current usage metrics is available 48-96 hours after online publication and is updated daily on week days.
Initial download of the metrics may take a while.