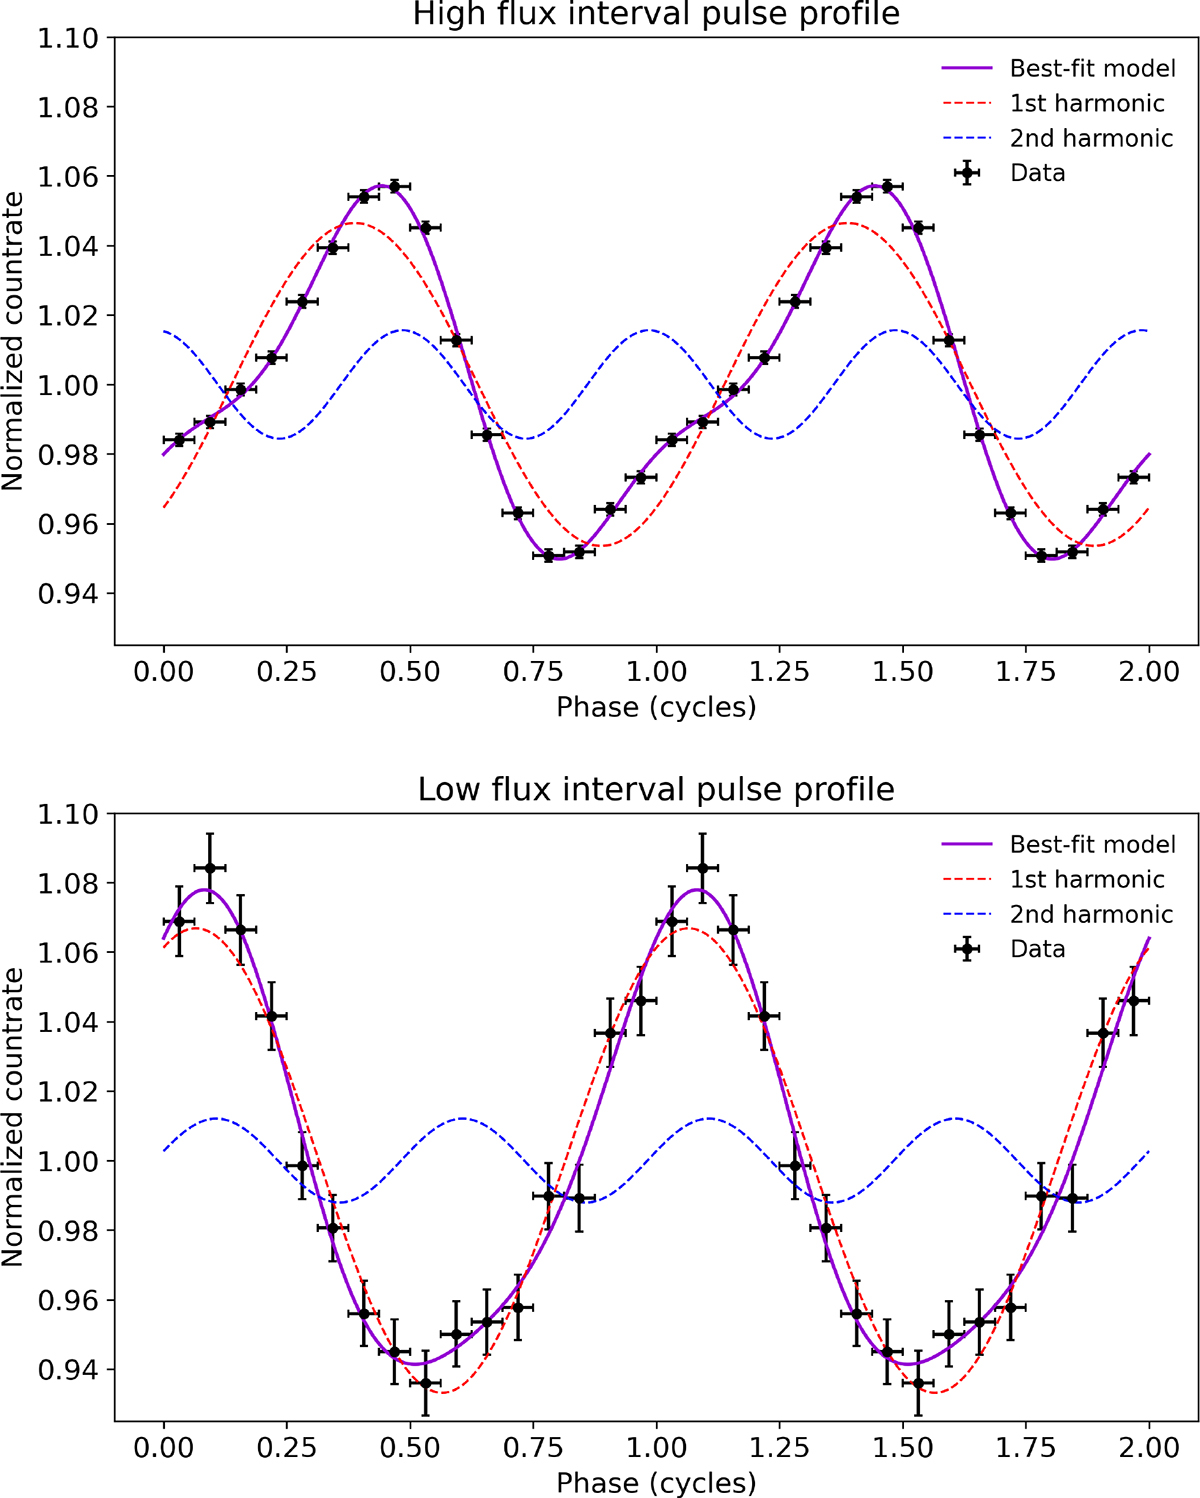
Fig. 3.
Download original image
X-ray pulse profiles obtained by folding the high- and low-flux intervals of XMM-Newton observation into 16 phase bins at a spin frequency of νF = 400.975209557 Hz. The solid line represents the best-fit model (constant plus two harmonics), while the dashed red and blue lines indicate the first and second harmonic contributions, respectively. For clarity, two cycles are shown.
Current usage metrics show cumulative count of Article Views (full-text article views including HTML views, PDF and ePub downloads, according to the available data) and Abstracts Views on Vision4Press platform.
Data correspond to usage on the plateform after 2015. The current usage metrics is available 48-96 hours after online publication and is updated daily on week days.
Initial download of the metrics may take a while.