Fig. 4.
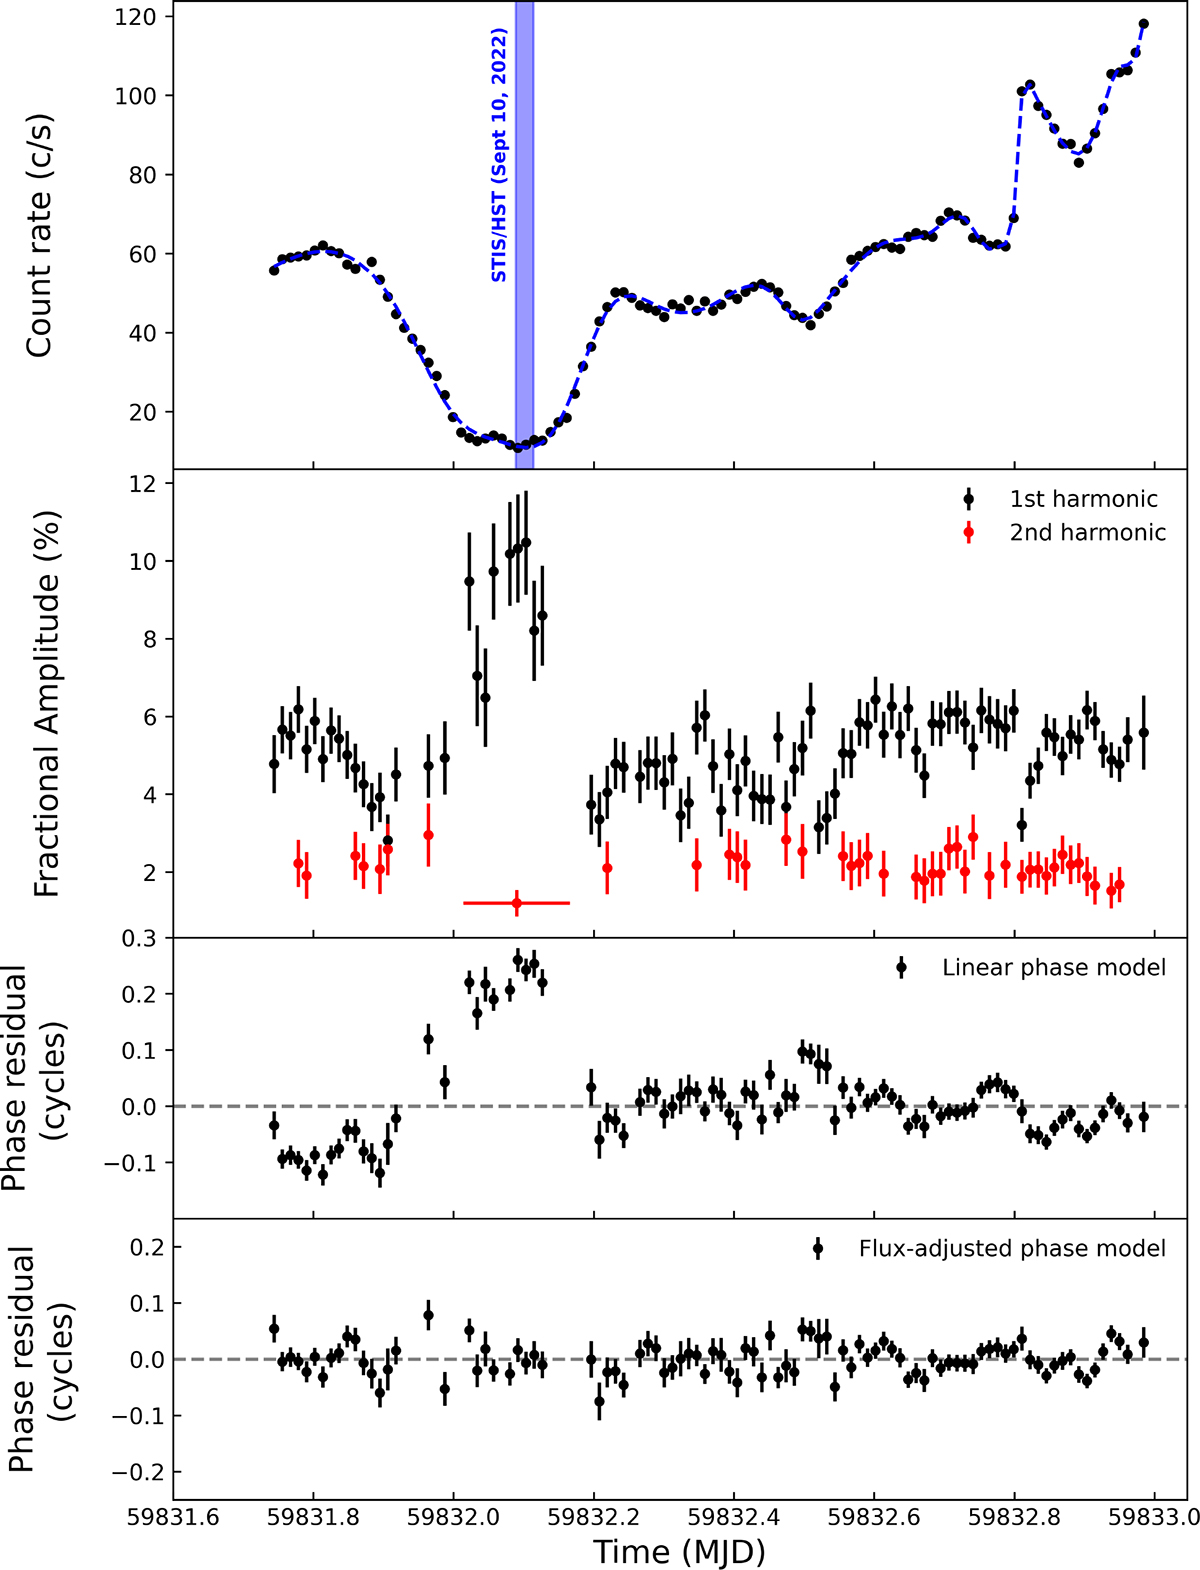
Download original image
Top panel: 0.5–10 keV XMM-Newton/EPIC-pn light curve using 1 ks bins, with Type I X-ray bursts removed. The dashed blue line shows the spline interpolation obtained with the UnivariateSpline function from scipy.interpolate. The blue band indicates the interval of the HST observation discussed in this paper (see Sect. 3.2 for details). Second panel: Pulse fractional amplitude for the first harmonic (black dots) and the second harmonic (red dots). Third and fourth panels: Phase residuals relative to a linear model and a model that includes a phase-flux correlation term, respectively. Note that, where not visible, the error bars are smaller than the data points.
Current usage metrics show cumulative count of Article Views (full-text article views including HTML views, PDF and ePub downloads, according to the available data) and Abstracts Views on Vision4Press platform.
Data correspond to usage on the plateform after 2015. The current usage metrics is available 48-96 hours after online publication and is updated daily on week days.
Initial download of the metrics may take a while.