Fig. 5.
Download original image
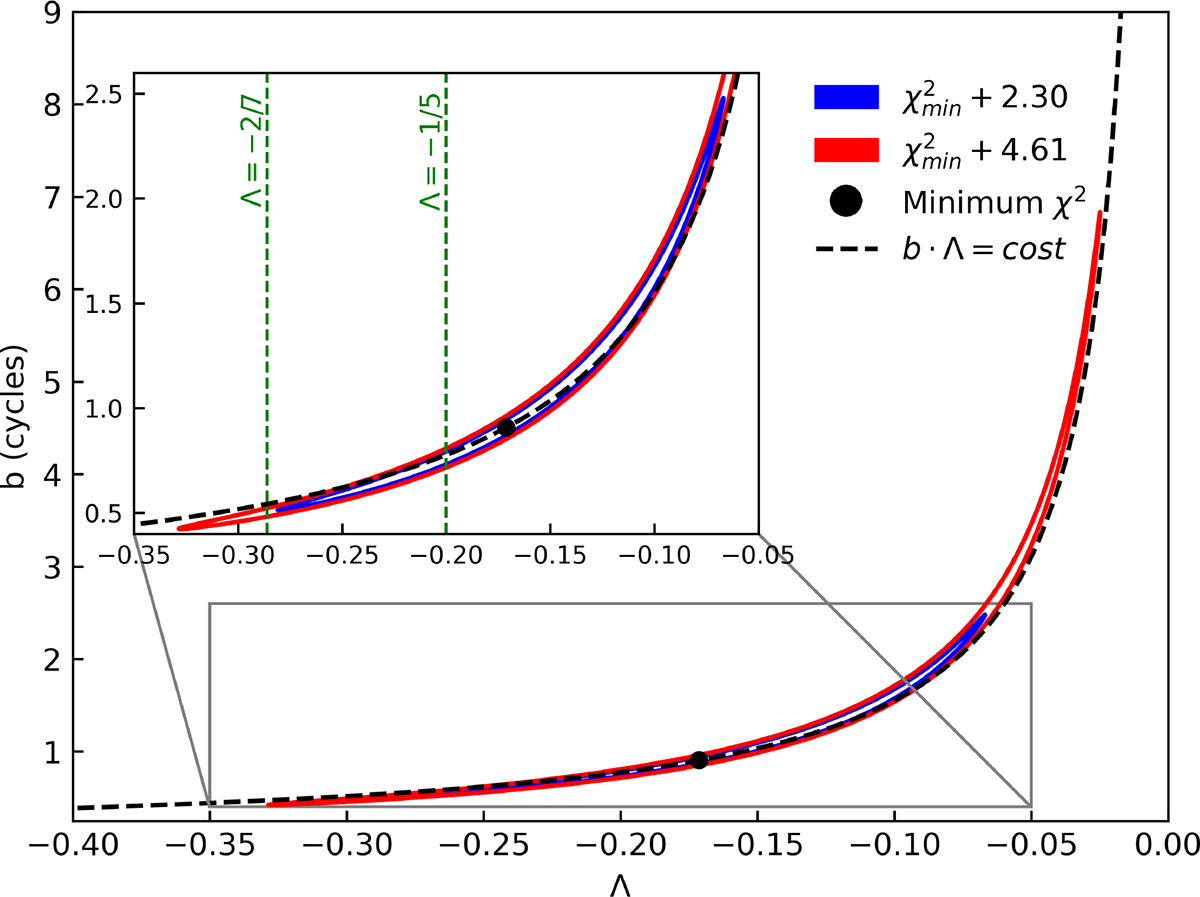
Contour levels of χ2 obtained by varying both parameters b and Λ in the flux-adjusted phase fit. The contour levels are shown for χmin2 + 2.3 (blue) and χmin2 + 4.61 (red), corresponding to confidence levels of 68% and 90%, respectively, for a fit with two parameters (Lampton et al. 1976). The black dot indicates the values of b and Λ corresponding to the minimum χ2, while the dashed black line represents the contour corresponding to the constant value given by the product b × Λ.
Current usage metrics show cumulative count of Article Views (full-text article views including HTML views, PDF and ePub downloads, according to the available data) and Abstracts Views on Vision4Press platform.
Data correspond to usage on the plateform after 2015. The current usage metrics is available 48-96 hours after online publication and is updated daily on week days.
Initial download of the metrics may take a while.