Fig. 8.
Download original image
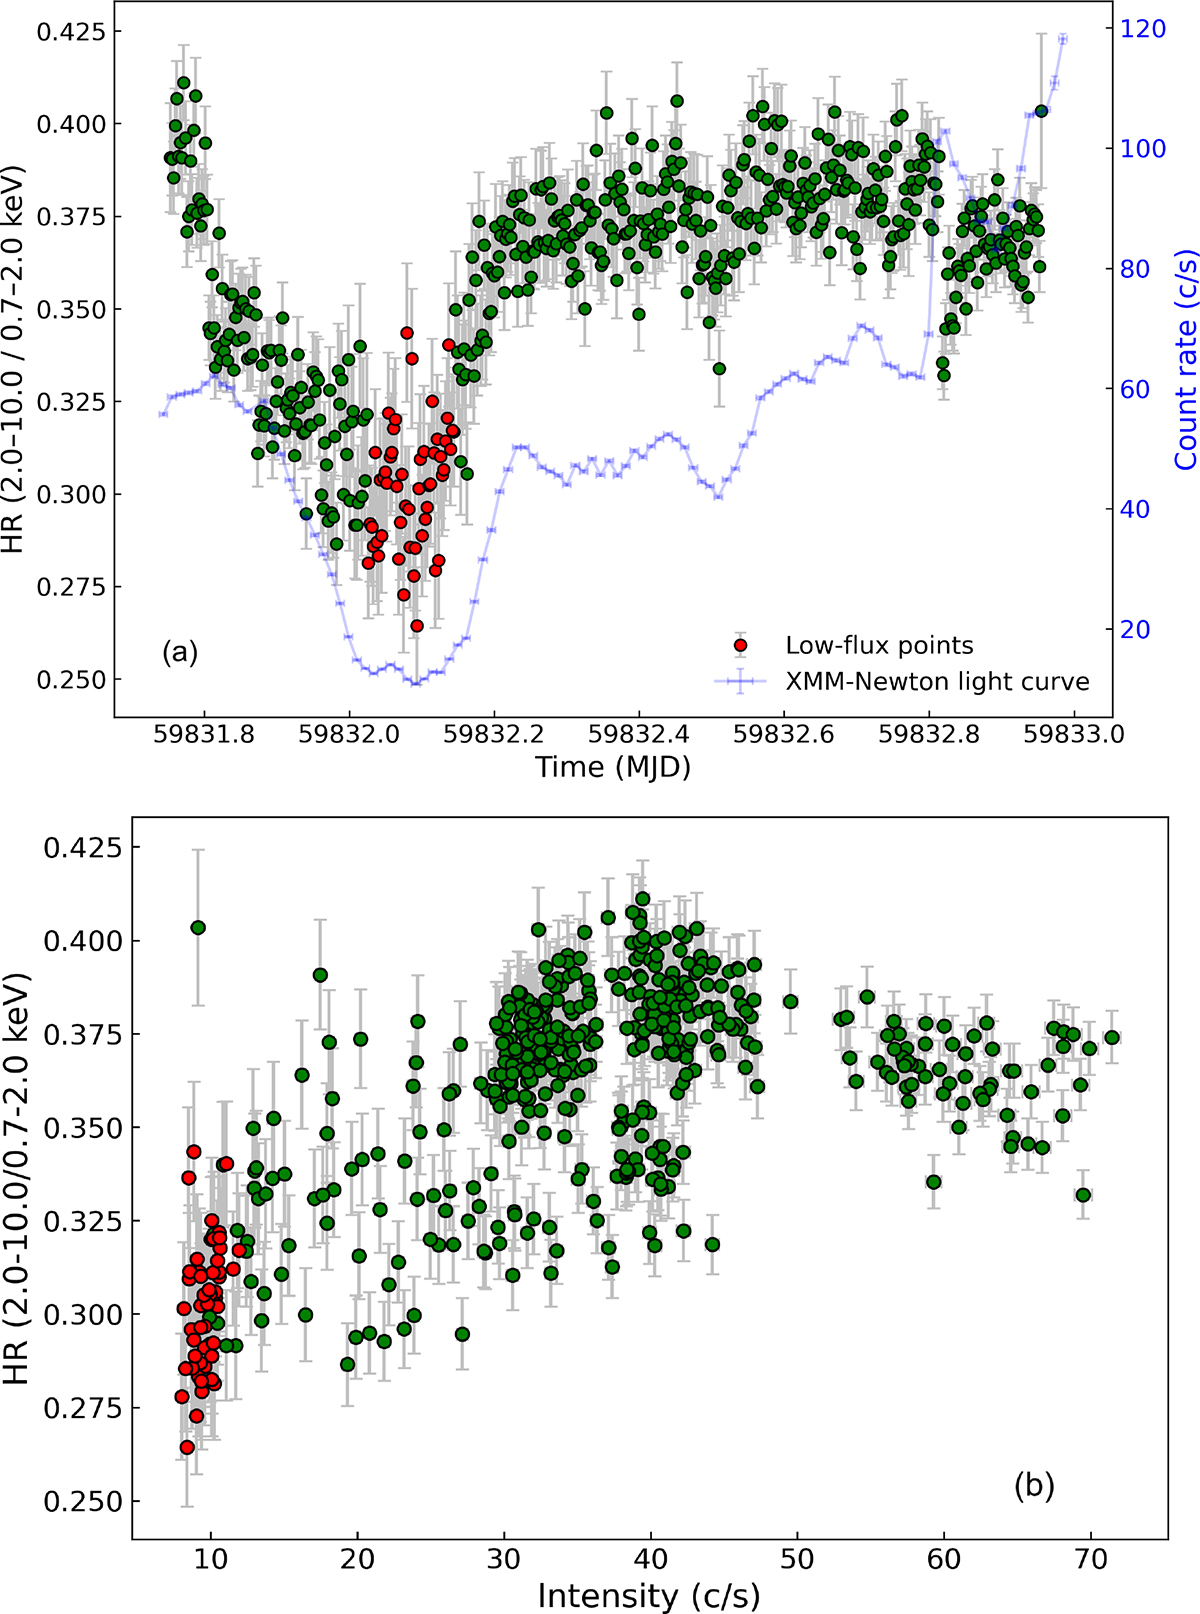
Panel (a): Evolution of HR of SAX J1808 during XMM-Newton observation of reflare phase of 2022 outburst. The HR was estimated from the (2–10 keV)/(0.7–2 keV) energy band. For comparison, the XMM-Newton light curve is shown in blue in the background. Panel (b): Hardness-intensity diagram (HID) of SAX J1808 obtained using XMM-Newton EPIC-pn observation and 200 s bins. The intensity is given in counts per second. The points corresponding to the minimum of the source X-ray flux on the light curve, between 59832.02 MJD and 59832.14 MJD, are marked in red.
Current usage metrics show cumulative count of Article Views (full-text article views including HTML views, PDF and ePub downloads, according to the available data) and Abstracts Views on Vision4Press platform.
Data correspond to usage on the plateform after 2015. The current usage metrics is available 48-96 hours after online publication and is updated daily on week days.
Initial download of the metrics may take a while.