Fig. 9.
Download original image
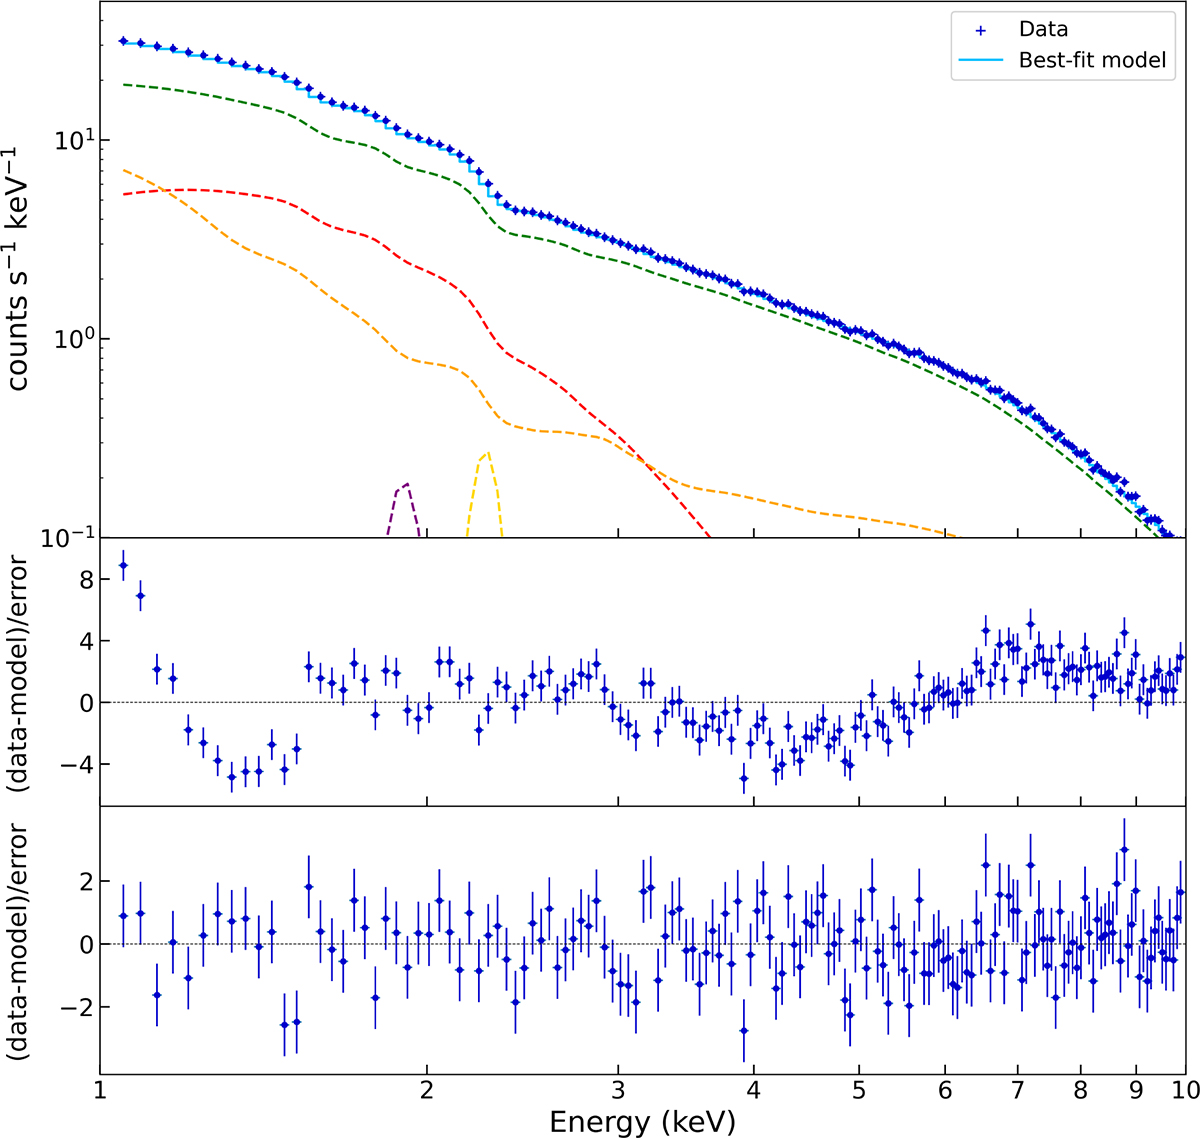
XMM-Newton/EPIC-pn spectrum (1.0–10 keV) of high-flux emission from SAX J1808 (top) and best-fit model plotted with a solid line and given in Table 2. The fit model is TBabs*(bbodyrad + gaussian + gaussian + gaussian + nthComp + rdblur*rfxconv*nthComp). The model components are also plotted as dashed lines: the blackbody component, bbodyrad, in red; the Comptonization component, nthcomp, in green; the reflection component in orange; and the Gaussians in purple and yellow. The bottom panel displays the residuals relative to the best-fit model, while the middle panel shows the residuals from a fit performed without the reflection component.
Current usage metrics show cumulative count of Article Views (full-text article views including HTML views, PDF and ePub downloads, according to the available data) and Abstracts Views on Vision4Press platform.
Data correspond to usage on the plateform after 2015. The current usage metrics is available 48-96 hours after online publication and is updated daily on week days.
Initial download of the metrics may take a while.