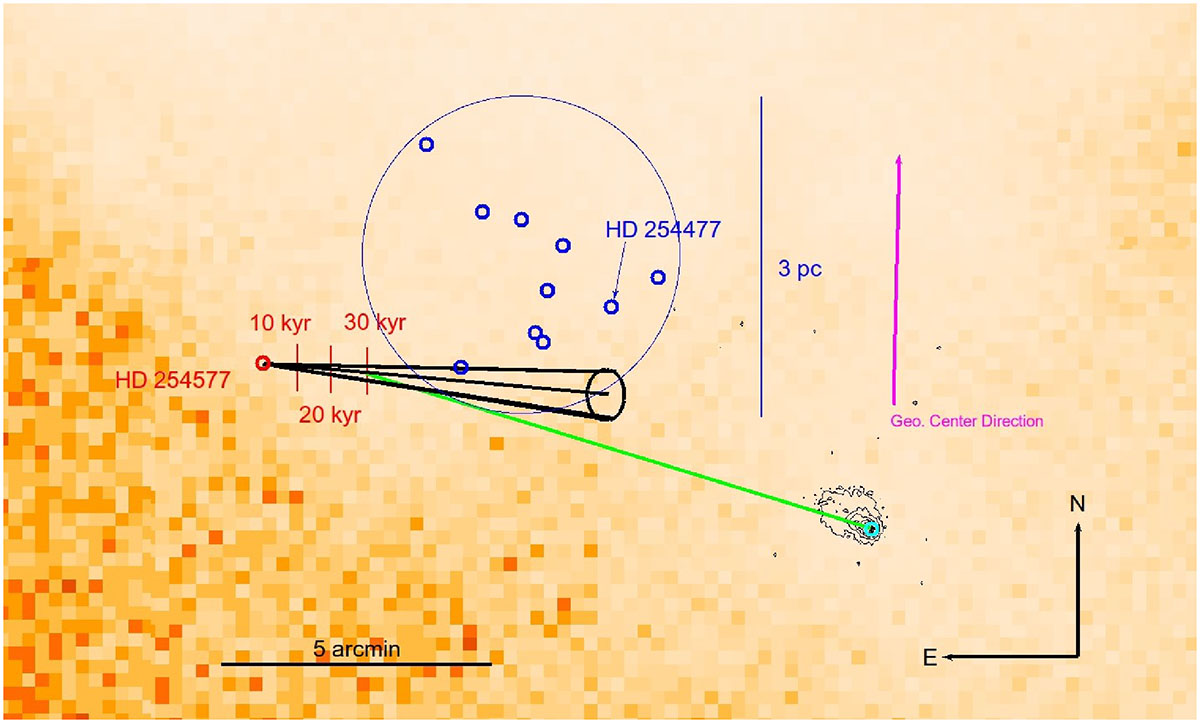
Fig. 6.
Download original image
Backward trajectory of HD 254577 proper motion relative to the cluster motion (black cone) sketched on the ROSAT PSPC (0.1–2.4 keV) image. The explosion sites for 10, 20, and 30 kyr are shown with red lines. The large blue circle shows the extent of the possible open cluster, with members denoted by small blue circles. Chandra ACIS contours of the NS (cyan circle) are overlaid in black. The green line roughly shows the direction of the NS motion from the 30 kyr explosion site, while the magenta vector shows the direction of the geometrical center of IC 443.
Current usage metrics show cumulative count of Article Views (full-text article views including HTML views, PDF and ePub downloads, according to the available data) and Abstracts Views on Vision4Press platform.
Data correspond to usage on the plateform after 2015. The current usage metrics is available 48-96 hours after online publication and is updated daily on week days.
Initial download of the metrics may take a while.