| Issue |
A&A
Volume 707, March 2026
|
|
|---|---|---|
| Article Number | A50 | |
| Number of page(s) | 12 | |
| Section | Stellar structure and evolution | |
| DOI | https://doi.org/10.1051/0004-6361/202556086 | |
| Published online | 25 February 2026 | |
Massive runaway star HD 254577: The pre-supernova binary companion to the progenitor of the supernova remnant IC 443
1
Astrophysikalisches Institut und Universitäts-Sternwarte Jena 07745 Jena, Germany
2
Orta Doğu Teknik Üniversitesi, Department of Physics 06800 Ankara, Türkiye
3
Boğaziçi University, Department of Physics 34342 İstanbul, Türkiye
4
Leibniz-Institut für Astrophysik Potsdam (AIP) An der Sternwarte 16 14482 Potsdam, Germany
5
Research School of Astronomy & Astrophysics, Australian National University Canberra ACT 2611, Australia
★ Corresponding author: This email address is being protected from spambots. You need JavaScript enabled to view it.
Received:
24
June
2025
Accepted:
10
December
2025
Abstract
Aims. The secondaries of massive binary systems can be found as runaway stars after being ejected due to the supernova (SN) of the more massive component. We search for such stars inside supernova remnants (SNRs), where a recent SN is guaranteed to have occurred and the runaway star is expected nearby. In this paper, we present the massive runaway star HD 254577 as the pre-SN binary companion to the progenitor of the SN remnant IC 443 and the neutron star (NS) CXOU J61705.3+222127.
Methods. We performed spectroscopic observations of the runaway star and specified its atmospheric parameters. We also used archival spectroscopic data on neighboring stars. Together with precise Gaia DR3 astrometry and photometry, we identified the possible birth origin of the runaway star. By isochrone fitting, we likewise determined its progenitor mass. From Gaia DR3 proper motions, we specified the possible explosion sites and calculated the NS velocity.
Results. HD 254577 is a hot and evolved star with an effective temperature of 24 000 ± 1000 K (B0.5II) and a surface gravity of log(g [cm/s2]) = 2.75 ± 0.25. It is probably a single star with a peculiar 3D velocity of 31.3−0.9+1.2 km s−1, lying at a heliocentric distance of 1701−54+55 pc. The cometary tail of the NS implies that it is moving away from the same site as the runaway star. From the flight trajectories, we calculated typical NS pulsar velocities of 254 − 539 km s−1 at a distance of 1.7 kpc for 10 − 20 kyr ages. Together with the blue-shifted interstellar medium lines in its spectrum, HD 254577 must be the pre-SN binary companion to the progenitor of IC 443. By identifying the pre-SN companion and the possible parent cluster, we show that the progenitor zero-age main-sequence mass is high (31 − 64 M⊙), favoring the jet scenario previously proposed. The SNR distance is precisely determined as 1701−54+55 pc. We also discuss the expansion dynamics of the SNR due to the highly off-centered explosion site. Our calculated pre-SN binary parameters might not favor a strongly interacting binary.
Key words: stars: general / stars: massive / stars: neutron / stars: individual: HD 254577 / ISM: supernova remnants / ISM: individual objects: IC 443
© The Authors 2026
 Open Access article, published by EDP Sciences, under the terms of the Creative Commons Attribution License (https://creativecommons.org/licenses/by/4.0), which permits unrestricted use, distribution, and reproduction in any medium, provided the original work is properly cited.
This article is published in open access under the Subscribe to Open model. This email address is being protected from spambots. You need JavaScript enabled to view it. to support open access publication.
1. Introduction
A significant portion of stars gain high velocities either by dynamical ejection due to gravitational interactions of massive stars in cluster cores (Poveda et al. 1967) or a binary disruption resulting from a supernova (SN) explosion of the initially more massive component (Blaauw 1961). A kinematical link of a runaway star to a neutron star (NS) such as PSR 1706−16 – ζ Oph (Neuhäuser et al. 2020) and PSR J0826+2637 – HIP 13962 (Tetzlaff et al. 2014), or to a visible SN remnant (SNR) (Dinçel et al. 2015) can be evidence for a binary supernova scenario (BSS).
In the cases where the compact object does not receive a significant kick and less than half of the total mass is ejected during the SN, the mass is stored in the secondary by conservative mass transfer, and binary disruption does not occur (van den Heuvel & van Paradijs 1997; van den Heuvel 1993). The runaway high-mass X-ray binaries 4U 1700-37 (Ankay et al. 2001), Vela X-1 (Kaper et al. 1997), and 4U 2206+54 (Hambaryan et al. 2022) are good examples of such surviving binaries.
The asymmetric SN explosion of a sufficiently massive star (> 10 M⊙) can eject the NS with velocities of 250–1300 km s−1 (Janka & Kresse 2024), which is remarkably faster than most of the objects in the Galaxy. The measured 2D pulsar velocities (typically 300–500 km s−1) confirm these theoretical values (Lyne & Lorimer 1994; Allakhverdiev et al. 1997; Hobbs et al. 2005). Therefore, most pulsars, as well as the majority of OB-type runaway stars, are found in isolation (Sayer et al. 1996). Considering the selection effects and the low rate of X-ray binaries, the binary disruption is highly likely (Guseinov et al. 2005). Binary disruption kinematics is extensively discussed in Tauris & Takens (1998). According to Renzo et al. (2019),  % of all massive star binaries do not merge before the SN, and
  % of them become unbound due to the SN.
Finding runaway stars as pre-SN binary companions inside SNRs provides valuable information. First, the explosion center can be accurately identified. Thus, the expansion of the SNR and the kick vector of the NS can be studied. Second, the mass of the progenitor star and the parameters of the pre-SN binary system can be determined, which helps clarify the origin of certain types of NSs and SNRs. Lastly, SNR distances can be precisely measured using the astrometric or spectroscopic parallax of the runaway star, as its velocity is much lower than the SNR shock wave and remains close to the explosion center in the observational lifetime of the SNR.
Despite prior efforts to find pre-SN binary companions inside SNRs (van den Bergh 1980; Boubert et al. 2017; Kerzendorf et al. 2019; Kochanek 2021; Lux et al. 2021; Dinçel et al. 2024b), the only highly confident example remains the massive runaway star HD 37424 inside SNR S147. It was shown that the runaway star and the pulsar PSR J0538+2817 were once at the same position in space at the same time 30 ± 4 kyr ago (Dinçel et al. 2015).
We expect that the runaway star in BSS should be young (matching the SN progenitor age), exhibit high peculiar velocity, and either move away from the SNR central region (Dinçel et al. 2015), share a common origin with an NS (Neuhäuser et al. 2020), or move away from a young open cluster where dynamical ejection is no longer expected (Dinçel et al. 2024a). The velocity threshold for runaway stars has been discussed in various studies. vpec = 28 and 25 km s−1 were suggested as the intersection of the Maxwellian distributions of the high and low velocity stellar populations (Tetzlaff et al. 2011; Tetzlaff 2013). Significantly higher values, 40 and 43 km s−1, were adopted by Berger & Gies (2001) and Guo et al. (2024) respectively, corresponding to the velocity at which the number of stars reaches 1% of the Maxwellian peak. On the other hand, a more conventional value of 30 km s−1 has often been used as a typical cutoff (e.g., Gies & Bolton 1986; Hoogerwerf et al. 2001; Eldridge et al. 2011; Renzo et al. 2019)
A more detailed review of the matter can be found in Dinçel et al. (2024b). In this paper, we propose that the HD 254577 star inside SNR IC 443 is a massive runaway star and a strong candidate for the pre-SN binary companion to the progenitor of SNR IC 443 and the NS CXOU J61705.3+222127. By finding this star, we determined the progenitor mass, possible pre-SN binary parameters, NS velocities, age, and distance of the SNR.
2. IC 443 and CXOU J61705.3+222127
IC 443 is a mixed morphology SNR (MMSNR) (Rho & Petre 1998) with an angular diameter of 45 arcmin located in the Galactic anticenter direction (Green 2009). The bright shell of the SNR (Fig. 1) has a similar morphology in radio, X-ray, and optical wave bands (Leahy 2004; Asaoka & Aschenbach 1994; Fesen 1984). The centrally peaked morphology in X-rays (Petre et al. 1988) is distinguished from other MMSNRs with peaks at two different positions, in the north and the center (Troja et al. 2008), explained by cloud evaporation. The blast wave interacts with the surrounding dense atomic and molecular clouds (Claussen et al. 1997; Snell et al. 2005). The SNR has two semispheres (subshells) sharing the same horizontal plane but with different radii and centroids (Fig. 1) due to expansion in a highly inhomogeneous environment. From radio observations, Braun & Strom (1986) concluded that the shock wave expands into a previously generated subshell in the east. X-ray observations – first Asaoka & Aschenbach (1994) with ASKA, and more recently Camilloni & Becker (2023) with SRG/eROSITA – showed that IC 443 is overlaps with the older SNR G189.6+03.3.
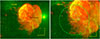 |
Fig. 1. X-ray (ROSAT PSPC, 0.1–2.4 keV, red) and optical (STScI DSS2 red, green) composite image of IC 443. Left: Geometrical center of the SNR (black cross) and the runaway star search region in Dinçel et al. (2024b) (surrounding black circle). A blue cross indicates the position of HD 254577, while a blue circle indicates that of the NS. The green box is the border of the image on the right. Right: Close-up image of the same. The big green circle represents a region with a radius of 10 pc, hosting a possible stellar group, while the small green circle shows a smaller, more compact group with a 1.5 pc radius. A 100 kyr magnified proper motion vector of HD 254577 is shown with a green arrow. |
The velocities of the shocked optical filaments are in the range of 60 − 100 km s−1 (Fesen & Kirshner 1980; Lozinskaya 1969; Bakış et al. 2024), while the Hα emitting diffuse gas exhibits velocities up to 350 km s−1. Considering projection effects, the shock velocity of 400 km s−1 was suggested by Lozinskaia (1979).
The SNR is thought to be connected to the Gem OB1 association (Humphreys 1978) and Sh 2–249 H II region (Galt & Kennedy 1968) at ∼1.5 kpc; hence, the distance of the SNR has been assumed to be the same. At this distance, Petre et al. (1988) suggested an age of 3 kyr based on the high plasma temperature (107 K) in the northeast rim, while Chevalier (1999) suggested 30 kyr from optical filament expansion, accounting for the pre-SN bubble. An age of 4 − 10 kyr was derived from the possible expansion of the ejecta ring and comparison of the radius of the southern shell (Troja et al. 2008). Kawasaki et al. (2005) proposed a larger age of 10 − 20 kyr considering its mixed-morphology nature.
Based on near-infrared Fe II line intensities, the extinction toward the SNR largely varies at AV = 2 − 6 mag within the northeastern shell (Kokusho et al. 2013). A similar result, AV = 2.5 − 3.4 mag, was derived from Hβ/Hα strength ratios (Fesen 1984), which is consistent with the NH ∼ 6.2 × 1021 cm−2 measured from the X-ray spectral fit (Troja et al. 2008). Due to dense molecular clouds in which the SNR expands, the AV value increases sharply beyond ∼1.6 kpc in that direction (Dinçel et al. 2024b).
Taking into account the abundances of the detected α−process elements, IC 443 originated from a core-collapse SN (Troja et al. 2008). By studying a jet-like structure in the northwest, Greco et al. (2018) proposed a massive progenitor with a mass of ∼30 M⊙.
The compact object of the SNR is a radio-quiet X-ray NS CXOU J61705.3+222127. Its pulsar wind nebula (PWN) and blackbody radiation are observable in X-rays (Olbert et al. 2001; Bocchino & Bykov 2001). So far, no pulse has been detected, probably because the polar beams do not sweep our line of sight. The hydrogen atmosphere model yields an effective temperature of Teff ≈ 6.8 × 10⁵ K, while the blackbody model results in a higher temperature, Teff ≈ 1.6 × 10⁶ K, close to that of the Vela pulsar (Swartz et al. 2015), a 10 − 30 kyr-old NS. The cooling age is also consistent with the SNR age of 30 kyr (Gaensler & Slane 2006). The pulsar period and the magnetic field strength are predicted to be P = 250 ms and Bdip = 2.0 × 10¹³ G, respectively, on the basis of the X-ray bolometric luminosity of the PWN, which is LPWN ≈ 1.4 × 1033 erg s−1. CXOU J61705.3+222127 is an energetic pulsar with a possible spin-down luminosity of Ė = (1−30) × 1036 erg s−1. The proper motion of the NS was measured with high uncertainty (μα* = −22.3 ± 33.9, μδ = −0.1 ± 33.9 mas yr−1; Swartz et al. 2015), implying motion mainly toward the west. From the cometary tail of the PWN in X-rays, the velocity of the NS is estimated to be 230 km s−1 (Gaensler et al. 2006).
The position of the NS is ∼12 arc minutes south of the geometric center. However, the bow-shock PWN, shaped by the supersonic motion of the NS, does not point back to the geometric center as its origin (Olbert et al. 2001). The parallactic angle of the cometary tail measures 71 ± 5°, suggesting east-to-west, rather than north-to-south motion. According to Leahy (2004), the NS might originate from another SNR, possibly G189.6+03.3. However, the very soft X-ray spectrum of this remnant, with a mean temperature of kT ∼ 0.14 keV (Leahy 2004), implies an age of ∼100 kyr (Bakış et al. 2024); this makes it significantly older than both IC 443 and the NS inferred from cooling curves. We therefore assume that the NS is the compact remnant of IC 443.
Previously, Dinçel et al. (2024b) searched for OB-type runaway stars within the central region of the SNR (Fig. 1). However, no OB-type runaway star candidate based on the proper motion was found in this central region. On the other hand, when we performed a search for OB-type stars with spectroscopic confirmation from Skiff (2013) in the entire SNR, we found that HD 254577 shows a significantly distinct proper motion value relative to the other seven OB-type stars. It may thus have the exact origin as the NS.
3. HD 254577 and neighboring stars
HD 254577 is a B0.5II-IIIk type star (Crawford et al. 1955) located on the western edge of IC 443 (Fig. 1). It is a pulsating star with a period of 3.991 ± 0.002 days and an amplitude of 6.16 ± 0.06 mmag (Shi et al. 2023). The temperature and luminosity measured in Shi et al. (2023) are Teff = 24332 K and log(L [L⊙]) = 4.18 (no error was mentioned). The Gaia DR3 (Gaia Collaboration 2016, 2023) parallax of the star is ϖ = 0.5513 ± 0.0175, and the geometric distance is  pc (Bailer-Jones et al. 2021). The proper motion of HD 254577 in right ascension (RA) and declination (Dec) is μα* = 4.303 ± 0.019 mas yr−1 and μδ = −1.464 ± 0.014 mas yr−1, respectively.
To determine its peculiar velocity and stellar parameters, as well as the progenitor mass, we tried to find a possible parent cluster or stars that are genetically connected to HD 254577. Using the Gaia DR3 catalog, we selected stars brighter than G < 17 mag, with parallax values between 0.5 and 0.6 mas detected on a significance larger than 10 and within 20 arc minutes of the runaway star. This radius corresponds to ∼10 pc at 1.7 kpc, a typical tidal radius of an open cluster. We found 85 stars (Table A.1) with a very narrow proper motion dispersion, 0.155 and 0.361 mas yr−1 in RA and Dec, translating to 1.25 and 2.91 km s−1 at 1.7 kpc, respectively. The average proper motion of this group is, therefore, μα* = 0.401 ± 0.155 mas yr−1 and μδ = −1.775 ± 0.361 mas yr−1, where the errors represent the standard deviations. The distance of this group is 1731 ± 68 pc. The proper motion of HD 254577 differs greatly from that of the group and points away from a more compact group of ten stars (Fig. 1), a potential young open cluster with a radius of 1.5 pc. The brightest star in this group is HD 254477, known to be a B8-type star (Fabricius et al. 2002). The proper motion of this group is μα* = 0.437 ± 0.078 mas yr−1 and μδ = −1.814 ± 0.0.249 mas yr−1, and the distance is 1710 ± 71 pc, which is well consistent with the distance of HD 254577,  pc. The Gaia DR3 names, geometrical distances, parallaxes, brightness in the G band, color indices, and proper motions are given in Table 1. The proper motion of the star with respect to the cluster is μα* = 3.866 ± 0.097 mas yr−1 and μδ = 0.350 ± 0.263 mas yr−1.
Identified members of the detected potential cluster.
An independent way of calculating the peculiar velocity of the star is to correct its proper motion for Galactic rotation and solar motion. The galactocentric distance to the Sun was taken to be 8.5 kpc, and the solar rotational velocity as 220 km s−1. We took the local standard of rest from Tetzlaff et al. (2011) as (U⊙,V⊙,W⊙) = (10.4 ± 0.4, 11.6 ± 0.2, 6.1 ± 0.2) km s−1. The resultant values for HD 254577 are μα* = 4.303 ± 0.019 mas yr−1 and μδ = −1.464 ± 0.014 mas yr−1.
The transverse peculiar velocities subsequently are  km s−1 with respect to the cluster, and 36.6 ± 0.2 km s−1 according to the galactic flat rotation model. In either case, HD 254577 is a runaway star.
4. Observations
We performed observations for the runaway stars HD 254577 and HD 254477 to measure the radial velocity (RV) and the atmospheric parameters. We also used archival spectroscopic data of neighboring stars to determine the temperature and surface gravity, and of the SNR filaments to find the real extension of the SNR.
4.1. Stellar spectra
The spectra of HD 254577 and HD 254477 were taken across several observing epochs with the Fibre Linked Échelle Astronomical Spectrograph (FLECHAS, Mugrauer et al. 2014) on the 90 cm Schmidt telescope at the University Observatory Jena (Table 2). FLECHAS provides a resolving power of R ∼ 9200 with 1 × 1 pixel binning and a wavelength range of 3900–8100 Å. The spectra of HD 254577 were also taken with 2 × 2 pixel binning, which reduces the resolving power to R ∼ 7000. For optimal calibration, three arc (Th-Ar lamp) and flatfield images (Tungsten lamp) were taken immediately before the science exposures. The detector integration time (DIT) for the lamp spectra is 5 s for 1 × 1 binning and 1.5 s for 2 × 2 binning. The charge-coupled device of FLECHAS was operated at a cooling temperature between −30°C and −40°C. A set of three dark frames was taken for each DIT used for the arc, flatfield, and science exposures, and were median-combined for efficient cosmic removal.
Log of observations for HD 254577 and HD 254477.
The high-resolution and high signal-to-noise spectrum of HD 254577 was taken with the High Dispersion Spectrograph (HDS) mounted on the Subaru 8.3 m telescope. The configuration served an echelle spectrum with a wavelength range of 3560–4830 Å and 5010–6240 Å, and a resolving power of R ∼ 90 000 for the 1 × 1 binning. A 600s DIT was given for each frame (Table 2). Again, three frames were combined to remove cosmics. Five arc- (Th-Ar lamp) and flatfield-images (Tungsten lamp) were taken together with ten bias frames at the end of the night.
The data obtained were reduced in the IRAF environment (Tody 1986). Dark frames were combined into master darks for all used integration times, which were then subtracted from the science, flat, and arc frames. The three frames of each were combined with the average sigma clipping rejection. Flats were then extracted first, followed by the science and arcs frames via tracing of the echelle apertures from the flats. After extraction, each science was divided by the corresponding flat. All science spectra were wavelength-calibrated using the emission lines of the extracted arc spectrum after they were identified. Next, the science spectra were normalized, and lastly the spectra in all the apertures were trimmed and combined into one single spectrum.
Large sky Area Multi-Object fiber Spectroscopic Telescope (LAMOST) (Cui et al. 2012), also known as the Guo Shoujing Telescope, located at the Xinglong Station of the National Astronomical Observatories of China (NAOC), is an astronomical instrument designed for wide-field (5 deg) multi-object spectroscopic surveys. It covers a wavelength range of 3700–9000 Å in the optical spectrum with a spectral resolution of R ∼ 1800 (low resolution) and R ∼ 7500 (medium resolution). LAMOST low-resolution spectra of 17 stars, including HD 254477, were also used. We retrieved the spectra from the LAMOST website1. We then normalized the spectra in the IRAF environment.
The spectra were compared with the nonlocal thermodynamic equilibrium (NLTE), line-blanketed, plane-parallel synthetic spectra (Fig. 2) calculated from the TLUSTY model atmospheres2 (Hubeny & Lanz 1995). The models are available for micro-turbulence velocities of ξ = 10 and ξ = 2 km s−1 and solar metallicity, with a grid resolution of 1000 K in temperature and 0.25 dex for the surface gravity, log(g). The grid resolution sets the uncertainties of the measurements.
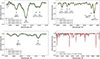 |
Fig. 2. Spectrum of HD 254577 with the overlaid model spectra of Teff = 23 000, 24 000, and 25 000 K with a fixed surface gravity of log(g [cm/s2]) = 2.75, a projected rotation velocity of v sin i = 150 km s−1, and a single micro-turbulence velocity of ξ = 10 km s−1. Top Left: Wavelength range of 4075 − 4140 Å. Si IVλ4089, 4116 lines are prominent temperature indicators. The spectrum is consistent with the Teff = 24 000 K model at the Si IVλ4116/ He Iλ4121 ratio. Top Right: Wavelength range of 4540 − 4660 Å. The spectrum is once again consistent with the T = 24 000 K model at the Si IVλ4089/ Si IIIλ4553 ratio. Bottom Left: Wavelength range of 4670 − 4725 Å. The spectrum is once again consistent with the Teff = 24 000 K model at the He IIλ4686/ He Iλ4713 ratio. Bottom Right: Spectrum of HD 254577 with the model spectrum of Teff = 24 000 K, log(g [cm/s2]) = 2.75, and ξ = 10 km s−1 overlaid. |
The model spectra were convolved with both the instrumental and rotational broadening functions. We determined the instrumental line-spread function from the arc exposures, where the emission lines are well described by a Gaussian profile. For example, the full width half maximum (FWHM) around Hβ is 0.5 Å (∼2.3 pixels). Next, we applied a Gray (2005) rotational profile, adopting a linear limb-darkening coefficient of ϵ = 0.6 for rotational velocities between 50 and 200 km s−1 in steps of 10 km s−1. This two-step convolution procedure ensures that the synthetic spectra reproduce the correct core–wing morphology of the hydrogen Balmer lines, whose wings are dominated by Stark broadening and are strongly sensitive to surface gravity.
We determined the surface gravity from the Hβ wings by visual comparison, and effective temperature from the silicon (Si IV/III) ionization balance, with helium (He II/I) used as a secondary check. Estimates from the two ratios generally agree to within ±1000 K.
We measured the RV of the runaway star in different epochs. The observed spectrum with the highest S/N ratio, taken on March 18, 2015, was shifted in wavelength space for heliocentric RV, then Fourier cross-correlated with a template model spectrum using the IRAF task fxcor. The wavelength ranges used for cross-correlation are 4295 − 4928, 5865 − 5885, 6540 − 6590, and 6650 − 6715 Å. We chose these wavelength ranges considering the data quality and the presence of prominent spectral features. We measured the RVs from other spectra of the runaway star with the same method, but using the March 18, 2015, spectrum as a template to maintain higher correlation heights (Table 3).
Radial velocity measurements of HD 254577.
4.2. SNR spectra
We also present the results of the optical emission associated with SNR G189.6 + 03.3 and IC 443 based on LAMOST low-resolution spectra. We used all available spectra of SNR G189.6 + 03.3 and IC 443. Among these, we chose 94 stellar spectra from 85 locations with a low continuum level (S/N < 10). The spectra were taken in 2017, and each DIT is 900 seconds.
Supernova remnants show a typical nebular spectrum dominated by strong emission lines of H and forbidden transitions of metals such as O, N, and S (Fig. 3). A wavelength range of 4200 − 6900 Å is sufficient to detect important features and calculate optical parameters from their fluxes (see Fesen et al. 2020; Boumis et al. 2022; Bakış et al. 2023; Paylı et al. 2024). LAMOST spectra show hydrogen Balmer lines, Hβλ4861, Hαλ6563 Å, and forbidden lines [O III] λλ4959/5007, [N II] λλ6548/6584, and [S II] λλ6716/6731 (Table A.2).
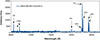 |
Fig. 3. LAMOST spectrum at α = 93.902500° δ = +22.256944°. The spectrum exhibits prominent emission lines including Hβλ4861, Hαλ6563, and forbidden lines [O III] λλ4959/5007, [O I] λλ6300, [N II] λλ6548/6584, and [S II] λλ6716/6731. |
We measured each flux individually from the already reduced spectra of LAMOST data using IRAF. Since they are reduced data, no flux calibration was performed. The fluxes of Hαλ6563 were taken to be 100. We normalized the fluxes of the spectra to Hαλ6563 and calculated the optical parameters of the SNRs (Table A.3).
For an accuracy check, we calculated the parameters of a single pointing, J061524.40+223308.8, from ten different LAMOST spectra. We found that the standard deviation of the [S II]/Hα ratios is 0.05 where the average ratio is 1.02. However, the standard deviation of the [O III]/Hβ ratio is 1.27 where the average ratio is 4.03. The low quality of the [O III]/Hβ ratio is due to the lower signal-to-noise ratio in the blue part of the spectrum and the weaker nature of these lines in the nebular spectrum (Fig. 3). Nevertheless, these spectra provide us with highly accurate [S II]/Hα and [S II] 6716/6731 ratios.
5. Results and discussion
Based on the comparison with the synthetic TLUSTY spectra, we determined that HD 254577 is a hot, evolved star with a Teff = 24 000 ± 1000 K, log(g [cm/s2]) = 2.75 ± 0.25 for solar metallicity, and an adopted micro-turbulence velocity of ξ = 10 km s−1 (Fig. 2 and Table 4). The projected rotational velocity of the star is v sin i = 150 ± 20 km s−1. The weighted mean heliocentric RV of HD 254577 is RVhelio = 17.1 ± 2.4 km s−1 with a standard deviation of 3.9 km s−1. Unfortunately, no RV measurement was available for the cluster; therefore, we do not have a reference RV. Thus, we calculated the peculiar RV using a flat Galactic rotation curve for a solar distance of 8.5 kpc and an orbital velocity of 220 km s−1. We found RVpec = −0.8 ± 3.9 km s−1. The peculiar 3D velocity, therefore, is  km s−1. This value is higher than the typical runaway star velocity criterion, 30 km s−1, yet lower than the ∼40 km s−1 threshold suggested by Berger & Gies (2001) and Guo et al. (2024). Nevertheless, according to Renzo et al. (2019), the SN-ejected massive runaway stars can have even lower velocities. HD 254477, the possible cluster member, shows a clear RV variation of ∼60 km s−1 suggesting a spectroscopic binary nature. In contrast, the runaway star does not show an RV variation beyond measurement uncertainties (Table 3), implying that it is a single star, as primarily expected for a runaway star (Fig. 4).
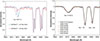 |
Fig. 4. Left: FLECHAS spectra of HD254477. Whereas the ISM Na I lines show no variation between epochs, the Doppler variation of He Iλ5876 line is clear. Right: FLECHAS spectra of HD254577. The He Iλ5876 triplet, as well as the Na I lines, does not show significant variation. |
Measured parameters for HD 254577.
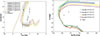 |
Fig. 5. Left:Teff vs. log(g) diagram of the runaway star and OB-type stars within 10 pc from the runaway star. Right: CMD of the runaway star and possible cluster members. Isochrones are set for a 1700 pc distance. The bright stars out of the isochrones are the runaway star and HD 254477. |
5.1. Parent cluster
HD 254577 most likely shares the same origin with the stars inside the small circle in Fig. 1 and some of the stars within 10 pc. Based on the archival LAMOST spectra, we determined the atmospheric parameters of 17 OB-type stars within 10 pc from the runaway star (Table 5). Two of the stars, HD 254477 (Teff = 26 000 K, log(g [cm/s2]) = 4.25) and J061731.40+222555.2 (Teff = 16 000 K, log(g [cm/s2]) = 4.25), lie inside the restricted region of the possible cluster. Hence, we set the color-magnitude diagram (CMD), i.e., G versus GBP−GRP, of these stars and the runaway star and compared it with theoretical isochrones. We produced isochrones for solar metallicity with the CMD 3.73 website using the “Parsec 1.2S” stellar evolutionary tracks (Chen et al. 2015), bolometric corrections from Girardi et al. (2008), and the extinction curve from Cardelli et al. (1989) and O’Donnell (1994) with an extinction law RV = 3.1. We used the canonical two-part power-law initial mass function introduced in Kroupa (2001, 2002) to compute the stellar occupation and masses along the isochrones. Apart from HD 254477 and HD 254577, the cluster stars are mainly aligned on the CMD (Fig. 5). However, the position of the two bright stars implies an age of log(age[yr]) = 7.8, where their observed and theoretical atmospheric parameters do not match. This is because the spatial variation of the extinction and the total-to-selective absorption ratio is quick and decisive (Kokusho et al. 2013). Therefore, we determined the cluster parameters by fitting isochrones on the Teff versus log(g) diagram. Although surface gravities have large uncertainties, temperatures were determined precisely enough to restrict the cluster parameters, and we found that the cluster age is log(age[yr]) = 6.7 ± 0.1 (Fig. 5). We identified the progenitor as the most evolved – and thus the most massive – star at the terminal point of each isochrone. The mass of the runaway star varies from 26 to 41 M⊙, while its zero-age main-sequence mass (ZAMS) ranges between 28 and 54 M⊙. The progenitor has a ZAMS mass of 31–64 M⊙ and a final mass of 16–21 M⊙ considering a mass loss for solar metallicity (Table 6).
Measured parameters of the stars observed with LAMOST.
Initial and current (final) masses of the runaway star and progenitor for different cluster ages.
The massive progenitor (> 30 M⊙) we propose in this work confirms Greco et al. (2018), who explained IC 443’s jet-like structures via the SN of a massive ∼30 M⊙ progenitor. It might also explain the high abundance of the α−process elements detected in Troja et al. (2008).
5.2. Kinematics
We traced the runaway star’s peculiar proper motion backward to find the explosion location, then calculated the transverse velocity of the NS for different possible ages. We multiplied the peculiar proper motion by five different SNR ages between 4 and 30 kyr and subtracted the angular distance obtained from the star’s position (Fig. 6). The NS coordinates, α = 94.27190° and δ = +22.35818° with a positional error of 0.6 arcsec, were retrieved from Lin et al. (2012). We measured the angular separation of the NS from each explosion location. As these positions depend on the time since explosion, we calculated the hypothetical proper motion of the NS by simply dividing the separation by the corresponding age. Finally, we calculated the transverse velocities in kilometers per second for a fixed distance of 1.7 kpc. The NS velocities between 10 − 20 kyr (vtrans = 254 − 538 km s−1) (Table 7) are consistent with typical pulsar velocities. The predicted velocity of the NS, 230 km s−1 (Gaensler et al. 2006) can be reached at higher ages. For a possible earlier age of 4 kyr (Troja et al. 2008), the NS moves exceptionally fast, with a velocity of ∼1400 km s−1. Considering the SNR age estimates in the literature and the NS velocity distribution, we suggest that the SNR is quite likely 10 − 20 kyr old.
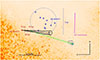 |
Fig. 6. Backward trajectory of HD 254577 proper motion relative to the cluster motion (black cone) sketched on the ROSAT PSPC (0.1–2.4 keV) image. The explosion sites for 10, 20, and 30 kyr are shown with red lines. The large blue circle shows the extent of the possible open cluster, with members denoted by small blue circles. Chandra ACIS contours of the NS (cyan circle) are overlaid in black. The green line roughly shows the direction of the NS motion from the 30 kyr explosion site, while the magenta vector shows the direction of the geometrical center of IC 443. |
Parameters from tracing back the runaway star.
The fact that the NS can attain typical space velocities for reasonable SNR ages provides further support for the pre-SN binary scenario we propose. On the other hand, although the runaway star moves away from the cluster, we note that its past position is not located inside the possible cluster circumference within 30 kyr. For larger ages, the NS velocity drops below 159 km s−1. Yet, the iron core-collapse origin of the SNR is strongly suggested, and such an SN generally forms a high NS-kick. The pre-SN system can still be genetically connected to the cluster but slightly drifted away owing to cluster dynamics, or simply the cluster is loosely bound with a more extensive radius.
5.3. Interstellar medium absorption lines
The high-velocity interstellar medium (ISM) absorption lines on the stellar spectra toward IC 443 were extensively studied in Welsh & Sallmen (2003), Hirschauer et al. (2009), Taylor et al. (2012), Ritchey et al. (2020). Several stars behind the SNR show blue- and red-shifted ISM absorption lines on their spectrum with velocities up to ∼100 km s−1. Although we did not find a new high-velocity absorption feature, we studied the prominent ISM features in the HDS spectrum of HD 254577. Assuming the observed features are dominated by the molecular cloud interacting with the SNR, we calculated the rest velocity for solar peculiar motion and the galactic rotation, as described in the Section 5.2. We found a characteristic velocity of 17.9 km s−1 and displayed this reference as the zero velocity in Fig. 7. Therefore, the largest positive velocity of the ISM lines is around 10 km s−1, which should not be considered as SNR acceleration. On the other hand, there are blue-shifted features at ∼ − 100 km s−1 that are most probably due to SNR expansion. This suggests that the runaway star is inside the SNR, so we detect no red-shifting ISM lines. This provides further strong evidence that the runaway star is the pre-SN binary companion of the progenitor of IC 443. Furthermore, the velocities found in Ritchey et al. (2020) for HD 254477, a possible cluster member, are highly similar to those of the runaway star, strengthening the idea that they are genetically connected.
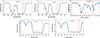 |
Fig. 7. ISM lines toward HD 254577 detected in the HDS spectrum. |
5.4. The SNR parameters
We determined the physical parameters and the actual size of the SNR based on the Balmer, Hβλ4861, Hαλ6563, and forbidden lines [O III] λλ4959/5007, as well as the [S II] λλ6716/6731 emission lines (Table A.2) in the LAMOST spectra taken from various pointings throughout the SNR. For the northeast region, together with one additional pointing from the east far outside IC 443, we found [S II]/Hα = 0.61 ± 0.14 to be considerably smaller than in the main body of IC 443, [S II]/Hα = 1.25 ± 0.38, and consistent with emission from an H II region and possibly the older SNR G189.6 + 03.3 (Table A.3). For the region slightly outside IC 443, we measured [S II]/Hα ratios higher than 0.8 from the long-slit spectra, supporting shock-heated gas emission (Fesen et al. 1985). We also detected ratios as high as 1.33 outside the bright filaments of IC 443, indicating that the actual size might be larger (Fig. 8).
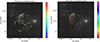 |
Fig. 8. Left: Measured [S II]/H α ratios represented by the color bar. The region includes SNRs IC 443 and the western part of G189.6 + 03.3. Two spectrum positions indicated by yellow arrows are α = 06h19m27.00s δ = +22d33′30.0″, and α = 06h17m49.70s δ = +22d01′25.3″. The strong [S II] emission suggests that these faint filaments belong to IC 443, rather than G189.6 + 03.3. Right: Same figure for [O III]/Hβ ratios. The [O III]/Hβ ratios are generally higher in the west and in the north compared to the east and the south. |
The [O III]λ5007 line relative to Hβ is mainly an indicator of the mean level of ionization and temperature (Dopita 1984). Based on a planar shock model of Hartigan et al. (1987), we calculated the [O iii]/Hβ ratios. For the northeast region, the observed ratio of [O III]/Hβ = 1.19 ± 0.42 indicates a shock velocity of 72 km s−1 with a complete recombination zone (see Raymond 1979; Shull & McKee 1979). The weak [O III] emission may be explained by slow shocks propagating into the ISM (Raymond et al. 1988). For the entire region, the observed ratio of [O III]/Hβ = 2.81 ± 2.26 indicates a relatively low T and a slow shock expansion (Osterbrock & Ferland 2006). Due to the low temperature, a slow shock velocity is observed in the southeast region, while relatively fast shock propagation continues in the western and northern regions.
We measured the electron density (Ne) based on [S II] 6717/6731 flux ratios (Osterbrock & Ferland 2006) using the temden task of the nebular package (Shaw & Dufour 1995), assuming an electron temperature (T) of 104 K. For the northeast and east regions outside IC 443, we found an average electron density of 224 ± 75 cm−3. On the other hand, in the IC 443 part, the average density is 146 ± 92 cm−3. Ne varies between 4 and 1257 cm−3 throughout the entire region, indicating the shock-heated ionized gas.
We derived a logarithmic extinction c for the northeast region and one additional pointing from the east region with the observed Hα/Hβ flux ratio. We measured a color excess of E(B − V) = 0.47 ± 0.11 and 0.92 ± 0.39 for the northeast and east regions, respectively. Using the relation NH = 5.4 × 10²¹ × E(B − V) (Predehl & Schmitt 1995), we calculated a total column density of ∼4.97 × 1021 cm−2 for the east region and a total column density of ∼2.54 × 1021 cm−2 for the northeast region. This implies that the H II regions in the northeast and east regions are much farther than the SNR, and that optical emission from these regions may not be related to IC 443. The values found in this section also coincide with the results of Bakış et al. (2024).
The extended geometry of IC 443 is also noticeable in X-rays (Fig. 9). Although the SNR entirely overlaps with G189.6 + 03.3, the high [S II]/Hα extension (Fig. 8) coincides with the X-ray contours, which gradually decrease in brightness toward the east. The position of the explosion is highly offset from the geometrical center of the bright IC 443. However, Ustamujic et al. (2021) explains IC 443’s asymmetric expansion due to the interaction with dense, inhomogeneously distributed molecular clouds and assumes the explosion center is not the geometrical center but the NS.
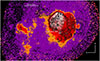 |
Fig. 9. ROSAT PSPC (0.1–2.4 keV) image of the IC 443 region. The overlaid black contours represent the bright optical filaments. The explosion sites from 0 to 30 kyr are shown as a white cone. The geometrical center is denoted by a white cross, and the NS is denoted by a white circle. The SNR lies in a complex region together with SNR G189.6 + 03.3 and H II regions. However, its true extent toward the east-southeast is probably significantly larger, and the explosion sites we found are closer to the real geometrical center. |
The shock wave of the SNR has either lost its energy or expands freely toward the east, creating this asymmetric shape. The lower values of [O III]/Hβ ratios in the east and south may indicate that the shock has lost a significant amount of energy and expands slowly in this direction due to the interaction with the dense molecular cloud.
5.5. Pre-SN binary
We calculated the pre-SN binary parameters for different companion and pre-SN progenitor masses, assuming the peculiar velocity of the runaway star equals the orbital velocity before the SN. We found large binary separations (Table 8) compared to the confirmed runaway star HD 37424 inside S 147 (Dinçel et al. 2015). HD 37424 shows high peculiar velocity, and it is highly likely that the pre-SN system experienced a common envelope evolution. In the most compact case, the components were separated only by ∼9 R⊙. We calculated the pre-SN binary parameters for the pre-SN mass configurations, according to Table 6 and considering lower progenitor masses as 15, 10, and 5 M⊙ owing to possible further mass loss due to binary interactions (van den Heuvel 1976; Taam & Sandquist 2000; Zapartas et al. 2017) (Table 8). We then calculated the Roche Lobe radii for the initial progenitor masses, using the largest binary separations in the previous calculations as if the separation remained unchanged throughout the history of the system, and the mass loss was due to metallicity rather than binary interaction (Table 9). The Roche Lobe radii we found in these cases are still large; however, a red supergiant can still fill in and accrete on the secondary. On the other hand, the values are much larger than blue supergiant radii. Common envelope evolution and a corresponding violent mass loss might not be likely. Yet, SNe of such massive stars are expected to form black holes by fallback. The channel generating NSs from stars more massive than 25 M⊙ represents extreme mass loss during their main-sequence lifetime. Zapartas et al. (2017) suggests that high metallicity alone is insufficient for such a mass loss. Instead, the primary star should experience mass loss through close binary interactions. We cannot predict the history of the pre-SN system; it is also possible that the separation increased due to mass transfer. Detailed simulations are needed for a clearer view of the matter.
Calculated parameters of the pre-SN binary for the peculiar velocity of 31 km s−1.
Roche Lobe radii.
6. Summary
We detected a massive, B0.5-type runaway star inside SNR IC 443. Using mid- to high-resolution spectroscopy, we found that the star HD 254577 is a hot (Teff = 24 000 ± 1000 K) and evolved (log(g [cm/s2]) = 2.75 ± 0.25, ξ = 10 km s−1) star with a projected rotational velocity of v sin i = 150 ± 20 km s−1 and a peculiar 3D velocity of  km s−1. The star’s proper motion direction and the cometary tail of the NS imply that they have the same origin – a binary SN. The transverse NS velocities (254–538 km s−1) calculated using the positions generated by tracing the runaway star backward are consistent with typical pulsar velocities for reasonable SNR ages (10 − 20 kyr). Also, the high-velocity ISM absorption lines in the star’s spectrum shift only toward the blue, suggesting that the star is inside the SNR, as expected from a runaway star linked to an SNR. We did not detect a significant variation in the RV of the star based on measurements from eight epochs; hence, it is most probably a single star, as expected for a typical runaway star. Given that HD 254577 is a hot, rare, isolated, fast-moving star located inside the SNR IC 443 and moving away from its NS, it is the pre-SN binary companion to IC 443’s progenitor.
By studying its neighboring stars and its possible host open cluster, we found that HD 254577 had a ZAMS mass of 28 − 54 M⊙, and that the progenitor’s ZAMS mass was even higher 31 − 64 M⊙. We confirmed the previous high mass estimates in Greco et al. (2018) and Troja et al. (2008). The distance of the SNR is the same as the distance of the runaway star,  pc, which is consistent with the distance of 1.80 ± 0.05 kpc proposed by Zhao et al. (2020) based on the extinction toward the background stars. The explosion site we determined is highly offset from the geometrical center, supporting the highly asymmetric expansion due to the surrounding molecular clouds demonstrated by Ustamujic et al. (2021). By studying the optical filaments of the SNR, we showed that its true extent is somewhat larger, and the shock wave has possibly lost energy toward the east and south. We also constructed the pre-SN binary system and displayed the orbital parameters. Binary interaction was not as strong as in the previously confirmed case HD 37424 in SNR S 147. The common envelope phase that helps the progenitors lose substantial mass and form NSs instead of black holes might not have occurred in this system.
Data Availability
Tables A.1–A.3 are available at the CDS via https://cdsarc.cds.unistra.fr/viz-bin/cat/J/A+A/707/A50
-
Table A.1 – Possible cluster members within 10 pc.
-
Table A.2 – Line strengths of SNR spectra.
-
Table A.3 – Physical parameters of the SNR.
Acknowledgments
This work was conceived by the late Oktay H. GUSEİNOV (1938–2009). We acknowledge his leading role in all stages of this work and other related topics. His contribution to Galactic Astrophysics and his scholarship will be greatly missed. This work is based on observations obtained with telescopes of the University Observatory Jena, operated by the Astrophysical Institute of the Friedrich-Schiller-University Jena. We appreciate the observational support from Daniel Wagner, Hartmut Gilbert, Kim Werner, and Anna Pannicke. This research is based on data collected at the Subaru Telescope, with run ID: S22A0154S, which is operated by the National Astronomical Observatory of Japan. We are honored and grateful for the opportunity of observing the Universe from Mauna Kea, which has cultural, historical, and natural significance in Hawaii. This research has made use of the “Aladin sky atlas” developed at CDS, Strasbourg Observatory, France. We gratefully acknowledge the support of NASA and the contributors of the SkyView surveys. The Digitized Sky Survey was produced at the Space Telescope Science Institute under U.S. Government grant NAG W-2166. The images of these surveys are based on photographic data obtained using the Oschin-Schmidt Telescope on Palomar Mountain and the UK Schmidt Telescope. The plates were processed into the present compressed digital form with the permission of these institutions. The research presented in this paper has used data from the Canadian Galactic Plane Survey, a Canadian project with international partners supported by the Natural Sciences and Engineering Research Council. We also acknowledge the ROSAT data archive provided by the Max-Planck-Institute for Extraterrestrial Physics, Garching, Germany.
References
- Allakhverdiev, A. O., Guseinov, O. H., Tagieva, S. O., & Yusifov, I. M. 1997, Astron. Rep., 41, 257 [NASA ADS] [Google Scholar]
- Ankay, A., Kaper, L., de Bruijne, J. H. J., et al. 2001, A&A, 370, 170 [NASA ADS] [CrossRef] [EDP Sciences] [Google Scholar]
- Asaoka, I., & Aschenbach, B. 1994, A&A, 284, 573 [NASA ADS] [Google Scholar]
- Bailer-Jones, C. A. L., Rybizki, J., Fouesneau, M., Demleitner, M., & Andrae, R. 2021, AJ, 161, 147 [Google Scholar]
- Bakış, H., Bulut, G., Bakış, V., Sano, H., & Sezer, A. 2023, MNRAS, 521, 1099 [Google Scholar]
- Bakış, H., Paylı, G., Aktekin, E., Sano, H., & Sezer, A. 2024, MNRAS, 532, 2570 [Google Scholar]
- Berger, D. H., & Gies, D. R. 2001, ApJ, 555, 364 [Google Scholar]
- Blaauw, A. 1961, Bull. Astron. Inst. Netherlands, 15, 265 [NASA ADS] [Google Scholar]
- Bocchino, F., & Bykov, A. M. 2001, A&A, 376, 248 [NASA ADS] [CrossRef] [EDP Sciences] [Google Scholar]
- Boubert, D., Fraser, M., Evans, N. W., Green, D. A., & Izzard, R. G. 2017, A&A, 606, A14 [NASA ADS] [CrossRef] [EDP Sciences] [Google Scholar]
- Boumis, P., Chiotellis, A., Fragkou, V., et al. 2022, MNRAS, 512, 1658 [Google Scholar]
- Braun, R., & Strom, R. G. 1986, A&A, 164, 193 [NASA ADS] [Google Scholar]
- Camilloni, F., & Becker, W. 2023, A&A, 680, A83 [NASA ADS] [CrossRef] [EDP Sciences] [Google Scholar]
- Cardelli, J. A., Clayton, G. C., & Mathis, J. S. 1989, ApJ, 345, 245 [Google Scholar]
- Chen, Y., Bressan, A., Girardi, L., et al. 2015, MNRAS, 452, 1068 [Google Scholar]
- Chevalier, R. A. 1999, ApJ, 511, 798 [Google Scholar]
- Claussen, M. J., Frail, D. A., Goss, W. M., & Gaume, R. A. 1997, ApJ, 489, 143 [NASA ADS] [CrossRef] [Google Scholar]
- Crawford, D., Limber, D. N., Mendoza, E., et al. 1955, ApJ, 121, 24 [Google Scholar]
- Cui, X.-Q., Zhao, Y.-H., Chu, Y.-Q., et al. 2012, Res. Astron. Astrophys., 12, 1197 [Google Scholar]
- Dinçel, B., Neuhäuser, R., Yerli, S. K., et al. 2015, MNRAS, 448, 3196 [CrossRef] [Google Scholar]
- Dinçel, B., Sheth, S., Specht, L., et al. 2024a, A&A, 691, A63 [NASA ADS] [CrossRef] [EDP Sciences] [Google Scholar]
- Dinçel, B., Uzuner, M., Neuhäuser, R., et al. 2024b, MNRAS, 531, 4212 [CrossRef] [Google Scholar]
- Dopita, M. A. 1984, in Structure and Evolution of the Magellanic Clouds, eds. S. van den Bergh, & K. S. D. de Boer, 108, 271 [Google Scholar]
- Eldridge, J. J., Langer, N., & Tout, C. A. 2011, MNRAS, 414, 3501 [NASA ADS] [CrossRef] [Google Scholar]
- Fabricius, C., Makarov, V. V., Knude, J., & Wycoff, G. L. 2002, A&A, 386, 709 [NASA ADS] [CrossRef] [EDP Sciences] [Google Scholar]
- Fesen, R. A. 1984, ApJ, 281, 658 [NASA ADS] [CrossRef] [Google Scholar]
- Fesen, R. A., & Kirshner, R. P. 1980, ApJ, 242, 1023 [NASA ADS] [CrossRef] [Google Scholar]
- Fesen, R. A., Blair, W. P., & Kirshner, R. P. 1985, ApJ, 292, 29 [Google Scholar]
- Fesen, R. A., Weil, K. E., Raymond, J. C., et al. 2020, MNRAS, 498, 5194 [NASA ADS] [CrossRef] [Google Scholar]
- Gaensler, B. M., & Slane, P. O. 2006, ARA&A, 44, 17 [Google Scholar]
- Gaensler, B. M., Chatterjee, S., Slane, P. O., et al. 2006, ApJ, 648, 1037 [NASA ADS] [CrossRef] [Google Scholar]
- Gaia Collaboration (Prusti, T., et al.) 2016, A&A, 595, A1 [NASA ADS] [CrossRef] [EDP Sciences] [Google Scholar]
- Gaia Collaboration (Vallenari, A., et al.) 2023, A&A, 674, A1 [NASA ADS] [CrossRef] [EDP Sciences] [Google Scholar]
- Galt, J. A., & Kennedy, J. E. D. 1968, AJ, 73, 135 [Google Scholar]
- Gies, D. R., & Bolton, C. T. 1986, ApJS, 61, 419 [Google Scholar]
- Girardi, L., Dalcanton, J., Williams, B., et al. 2008, PASP, 120, 583 [NASA ADS] [CrossRef] [Google Scholar]
- Gray, D. F. 2005, The Observation and Analysis of Stellar Photospheres, 3rd edn. (Cambridge: Cambridge University Press) [Google Scholar]
- Greco, E., Miceli, M., Orlando, S., et al. 2018, A&A, 615, A157 [NASA ADS] [CrossRef] [EDP Sciences] [Google Scholar]
- Green, D. A. 2009, VizieR On-line Data Catalog: VII/253 [Google Scholar]
- Guo, Y., Wang, L., Liu, C., et al. 2024, ApJS, 272, 45 [Google Scholar]
- Guseinov, O. H., Ankay, A., & Tagieva, S. O. 2005, Astrophysics, 48, 330 [NASA ADS] [CrossRef] [Google Scholar]
- Hambaryan, V., Stoyanov, K. A., Mugrauer, M., et al. 2022, MNRAS, 511, 4123 [NASA ADS] [CrossRef] [Google Scholar]
- Hartigan, P., Raymond, J., & Hartmann, L. 1987, ApJ, 316, 323 [Google Scholar]
- Hirschauer, A., Federman, S. R., Wallerstein, G., & Means, T. 2009, ApJ, 696, 1533 [Google Scholar]
- Hobbs, G., Lorimer, D. R., Lyne, A. G., & Kramer, M. 2005, MNRAS, 360, 974 [Google Scholar]
- Hoogerwerf, R., de Bruijne, J. H. J., & de Zeeuw, P. T. 2001, A&A, 365, 49 [NASA ADS] [CrossRef] [EDP Sciences] [Google Scholar]
- Hubeny, I., & Lanz, T. 1995, ApJ, 439, 875 [Google Scholar]
- Humphreys, R. M. 1978, ApJS, 38, 309 [NASA ADS] [CrossRef] [Google Scholar]
- Janka, H.-T., & Kresse, D. 2024, Ap&SS, 369, 80 [NASA ADS] [CrossRef] [Google Scholar]
- Kaper, L., van Loon, J. T., Augusteijn, T., et al. 1997, ApJ, 475, L37 [NASA ADS] [CrossRef] [Google Scholar]
- Kawasaki, M., Ozaki, M., Nagase, F., Inoue, H., & Petre, R. 2005, ApJ, 631, 935 [Google Scholar]
- Kerzendorf, W. E., Do, T., de Mink, S. E., et al. 2019, A&A, 623, A34 [NASA ADS] [CrossRef] [EDP Sciences] [Google Scholar]
- Kochanek, C. S. 2021, MNRAS, 507, 5832 [NASA ADS] [CrossRef] [Google Scholar]
- Kokusho, T., Nagayama, T., Kaneda, H., et al. 2013, ApJ, 768, L8 [Google Scholar]
- Kroupa, P. 2001, MNRAS, 322, 231 [NASA ADS] [CrossRef] [Google Scholar]
- Kroupa, P. 2002, Science, 295, 82 [Google Scholar]
- Leahy, D. A. 2004, AJ, 127, 2277 [NASA ADS] [CrossRef] [Google Scholar]
- Lin, D., Webb, N. A., & Barret, D. 2012, ApJ, 756, 27 [NASA ADS] [CrossRef] [Google Scholar]
- Lozinskaia, T. A. 1979, A&A, 71, 29 [Google Scholar]
- Lozinskaya, T. A. 1969, Soviet Ast., 13, 192 [Google Scholar]
- Lux, O., Neuhäuser, R., Mugrauer, M., & Bischoff, R. 2021, Astron. Nachr., 342, 553 [NASA ADS] [CrossRef] [Google Scholar]
- Lyne, A. G., & Lorimer, D. R. 1994, Nature, 369, 127 [NASA ADS] [CrossRef] [Google Scholar]
- Mugrauer, M., Avila, G., & Guirao, C. 2014, Astron. Nachr., 335, 417 [NASA ADS] [CrossRef] [Google Scholar]
- Neuhäuser, R., Gießler, F., & Hambaryan, V. V. 2020, MNRAS, 498, 899 [CrossRef] [Google Scholar]
- O’Donnell, J. E. 1994, ApJ, 422, 158 [Google Scholar]
- Olbert, C. M., Clearfield, C. R., Williams, N. E., Keohane, J. W., & Frail, D. A. 2001, ApJ, 554, L205 [NASA ADS] [CrossRef] [Google Scholar]
- Osterbrock, D. E., & Ferland, G. J. 2006, Astrophysics of Gaseous Nebulae and Active Galactic Nuclei (University Science Books) [Google Scholar]
- Paylı, G., Bakış, H., Aktekin, E., Sano, H., & Sezer, A. 2024, MNRAS, 527, 11685 [Google Scholar]
- Petre, R., Szymkowiak, A. E., Seward, F. D., & Willingale, R. 1988, ApJ, 335, 215 [Google Scholar]
- Poveda, A., Ruiz, J., & Allen, C. 1967, Boletin de los Observatorios Tonantzintla y Tacubaya, 4, 86 [Google Scholar]
- Predehl, P., & Schmitt, J. H. M. M. 1995, A&A, 293, 889 [NASA ADS] [Google Scholar]
- Raymond, J. C. 1979, ApJS, 39, 1 [NASA ADS] [CrossRef] [Google Scholar]
- Raymond, J. C., Hester, J. J., Cox, D., et al. 1988, ApJ, 324, 869 [NASA ADS] [CrossRef] [Google Scholar]
- Renzo, M., Zapartas, E., de Mink, S. E., et al. 2019, A&A, 624, A66 [NASA ADS] [CrossRef] [EDP Sciences] [Google Scholar]
- Rho, J., & Petre, R. 1998, ApJ, 503, L167 [NASA ADS] [CrossRef] [Google Scholar]
- Ritchey, A. M., Jenkins, E. B., Federman, S. R., et al. 2020, ApJ, 897, 83 [NASA ADS] [CrossRef] [Google Scholar]
- Sayer, R. W., Nice, D. J., & Kaspi, V. M. 1996, ApJ, 461, 357 [NASA ADS] [CrossRef] [Google Scholar]
- Shaw, R. A., & Dufour, R. J. 1995, PASP, 107, 896 [NASA ADS] [CrossRef] [Google Scholar]
- Shi, X.-D., Qian, S.-B., Zhu, L.-Y., et al. 2023, ApJS, 265, 33 [Google Scholar]
- Shull, J. M., & McKee, C. F. 1979, ApJ, 227, 131 [Google Scholar]
- Skiff, B. A. 2013, VizieR Online Data Catalog, 1, 2023 [Google Scholar]
- Snell, R. L., Hollenbach, D., Howe, J. E., et al. 2005, ApJ, 620, 758 [CrossRef] [Google Scholar]
- Swartz, D. A., Pavlov, G. G., Clarke, T., et al. 2015, ApJ, 808, 84 [NASA ADS] [CrossRef] [Google Scholar]
- Taam, R. E., & Sandquist, E. L. 2000, ARA&A, 38, 113 [NASA ADS] [CrossRef] [Google Scholar]
- Tauris, T. M., & Takens, R. J. 1998, A&A, 330, 1047 [NASA ADS] [Google Scholar]
- Taylor, C. J., Ritchey, A. M., Federman, S. R., & Lambert, D. L. 2012, ApJ, 750, L15 [NASA ADS] [CrossRef] [Google Scholar]
- Tetzlaff, N. U. 2013, Ph.D. Thesis, Friedrich Schiller University of Jena, Germany [Google Scholar]
- Tetzlaff, N., Neuhäuser, R., & Hohle, M. M. 2011, MNRAS, 410, 190 [Google Scholar]
- Tetzlaff, N., Dinçel, B., Neuhäuser, R., & Kovtyukh, V. V. 2014, MNRAS, 438, 3587 [NASA ADS] [CrossRef] [Google Scholar]
- Tody, D. 1986, Proc. SPIE, 627, 733 [NASA ADS] [CrossRef] [Google Scholar]
- Troja, E., Bocchino, F., Miceli, M., & Reale, F. 2008, A&A, 485, 777 [NASA ADS] [CrossRef] [EDP Sciences] [Google Scholar]
- Ustamujic, S., Orlando, S., Greco, E., et al. 2021, A&A, 649, A14 [NASA ADS] [CrossRef] [EDP Sciences] [Google Scholar]
- van den Bergh, S. 1980, JApA, 1, 67 [Google Scholar]
- van den Heuvel, E. P. J. 1976, in Structure and Evolution of Close Binary Systems, eds. P. Eggleton, S. Mitton, & J. Whelan, 73, 35 [Google Scholar]
- van den Heuvel, E. P. J. 1993, Space Sci. Rev., 66, 309 [NASA ADS] [CrossRef] [Google Scholar]
- van den Heuvel, E. P. J., & van Paradijs, J. 1997, ApJ, 483, 399 [CrossRef] [Google Scholar]
- Welsh, B. Y., & Sallmen, S. 2003, A&A, 408, 545 [NASA ADS] [CrossRef] [EDP Sciences] [Google Scholar]
- Zapartas, E., de Mink, S. E., Van Dyk, S. D., et al. 2017, ApJ, 842, 125 [CrossRef] [Google Scholar]
- Zhao, H., Jiang, B., Li, J., et al. 2020, ApJ, 891, 137 [CrossRef] [Google Scholar]
All Tables
Initial and current (final) masses of the runaway star and progenitor for different cluster ages.
Calculated parameters of the pre-SN binary for the peculiar velocity of 31 km s−1.
All Figures
|
Fig. 1. X-ray (ROSAT PSPC, 0.1–2.4 keV, red) and optical (STScI DSS2 red, green) composite image of IC 443. Left: Geometrical center of the SNR (black cross) and the runaway star search region in Dinçel et al. (2024b) (surrounding black circle). A blue cross indicates the position of HD 254577, while a blue circle indicates that of the NS. The green box is the border of the image on the right. Right: Close-up image of the same. The big green circle represents a region with a radius of 10 pc, hosting a possible stellar group, while the small green circle shows a smaller, more compact group with a 1.5 pc radius. A 100 kyr magnified proper motion vector of HD 254577 is shown with a green arrow. |
| In the text | |
|
Fig. 2. Spectrum of HD 254577 with the overlaid model spectra of Teff = 23 000, 24 000, and 25 000 K with a fixed surface gravity of log(g [cm/s2]) = 2.75, a projected rotation velocity of v sin i = 150 km s−1, and a single micro-turbulence velocity of ξ = 10 km s−1. Top Left: Wavelength range of 4075 − 4140 Å. Si IVλ4089, 4116 lines are prominent temperature indicators. The spectrum is consistent with the Teff = 24 000 K model at the Si IVλ4116/ He Iλ4121 ratio. Top Right: Wavelength range of 4540 − 4660 Å. The spectrum is once again consistent with the T = 24 000 K model at the Si IVλ4089/ Si IIIλ4553 ratio. Bottom Left: Wavelength range of 4670 − 4725 Å. The spectrum is once again consistent with the Teff = 24 000 K model at the He IIλ4686/ He Iλ4713 ratio. Bottom Right: Spectrum of HD 254577 with the model spectrum of Teff = 24 000 K, log(g [cm/s2]) = 2.75, and ξ = 10 km s−1 overlaid. |
| In the text | |
|
Fig. 3. LAMOST spectrum at α = 93.902500° δ = +22.256944°. The spectrum exhibits prominent emission lines including Hβλ4861, Hαλ6563, and forbidden lines [O III] λλ4959/5007, [O I] λλ6300, [N II] λλ6548/6584, and [S II] λλ6716/6731. |
| In the text | |
|
Fig. 4. Left: FLECHAS spectra of HD254477. Whereas the ISM Na I lines show no variation between epochs, the Doppler variation of He Iλ5876 line is clear. Right: FLECHAS spectra of HD254577. The He Iλ5876 triplet, as well as the Na I lines, does not show significant variation. |
| In the text | |
|
Fig. 5. Left:Teff vs. log(g) diagram of the runaway star and OB-type stars within 10 pc from the runaway star. Right: CMD of the runaway star and possible cluster members. Isochrones are set for a 1700 pc distance. The bright stars out of the isochrones are the runaway star and HD 254477. |
| In the text | |
|
Fig. 6. Backward trajectory of HD 254577 proper motion relative to the cluster motion (black cone) sketched on the ROSAT PSPC (0.1–2.4 keV) image. The explosion sites for 10, 20, and 30 kyr are shown with red lines. The large blue circle shows the extent of the possible open cluster, with members denoted by small blue circles. Chandra ACIS contours of the NS (cyan circle) are overlaid in black. The green line roughly shows the direction of the NS motion from the 30 kyr explosion site, while the magenta vector shows the direction of the geometrical center of IC 443. |
| In the text | |
|
Fig. 7. ISM lines toward HD 254577 detected in the HDS spectrum. |
| In the text | |
|
Fig. 8. Left: Measured [S II]/H α ratios represented by the color bar. The region includes SNRs IC 443 and the western part of G189.6 + 03.3. Two spectrum positions indicated by yellow arrows are α = 06h19m27.00s δ = +22d33′30.0″, and α = 06h17m49.70s δ = +22d01′25.3″. The strong [S II] emission suggests that these faint filaments belong to IC 443, rather than G189.6 + 03.3. Right: Same figure for [O III]/Hβ ratios. The [O III]/Hβ ratios are generally higher in the west and in the north compared to the east and the south. |
| In the text | |
|
Fig. 9. ROSAT PSPC (0.1–2.4 keV) image of the IC 443 region. The overlaid black contours represent the bright optical filaments. The explosion sites from 0 to 30 kyr are shown as a white cone. The geometrical center is denoted by a white cross, and the NS is denoted by a white circle. The SNR lies in a complex region together with SNR G189.6 + 03.3 and H II regions. However, its true extent toward the east-southeast is probably significantly larger, and the explosion sites we found are closer to the real geometrical center. |
| In the text | |
Current usage metrics show cumulative count of Article Views (full-text article views including HTML views, PDF and ePub downloads, according to the available data) and Abstracts Views on Vision4Press platform.
Data correspond to usage on the plateform after 2015. The current usage metrics is available 48-96 hours after online publication and is updated daily on week days.
Initial download of the metrics may take a while.