Fig. 8.
Download original image
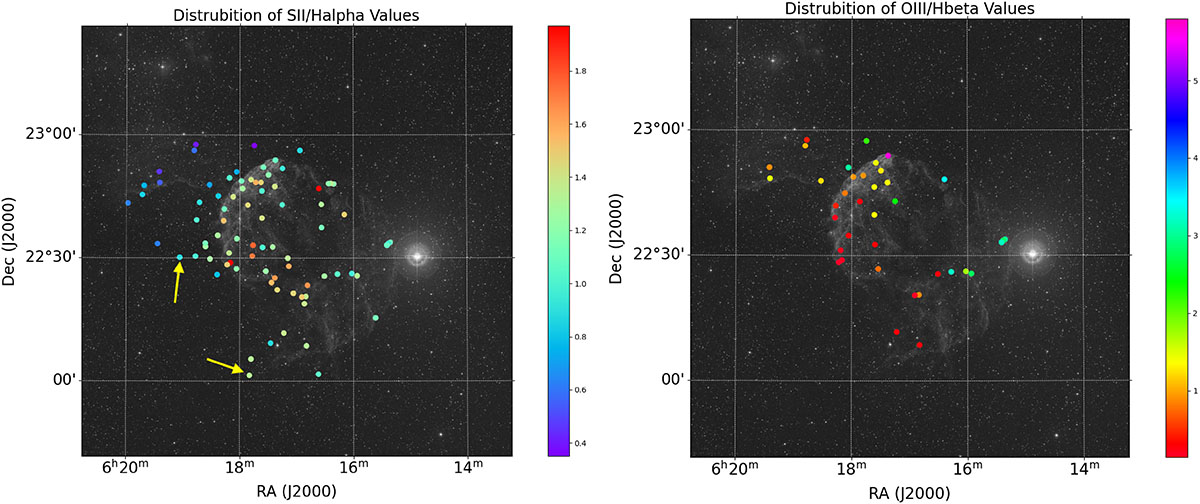
Left: Measured [S II]/H α ratios represented by the color bar. The region includes SNRs IC 443 and the western part of G189.6 + 03.3. Two spectrum positions indicated by yellow arrows are α = 06h19m27.00s δ = +22d33′30.0″, and α = 06h17m49.70s δ = +22d01′25.3″. The strong [S II] emission suggests that these faint filaments belong to IC 443, rather than G189.6 + 03.3. Right: Same figure for [O III]/Hβ ratios. The [O III]/Hβ ratios are generally higher in the west and in the north compared to the east and the south.
Current usage metrics show cumulative count of Article Views (full-text article views including HTML views, PDF and ePub downloads, according to the available data) and Abstracts Views on Vision4Press platform.
Data correspond to usage on the plateform after 2015. The current usage metrics is available 48-96 hours after online publication and is updated daily on week days.
Initial download of the metrics may take a while.