Fig. 9.
Download original image
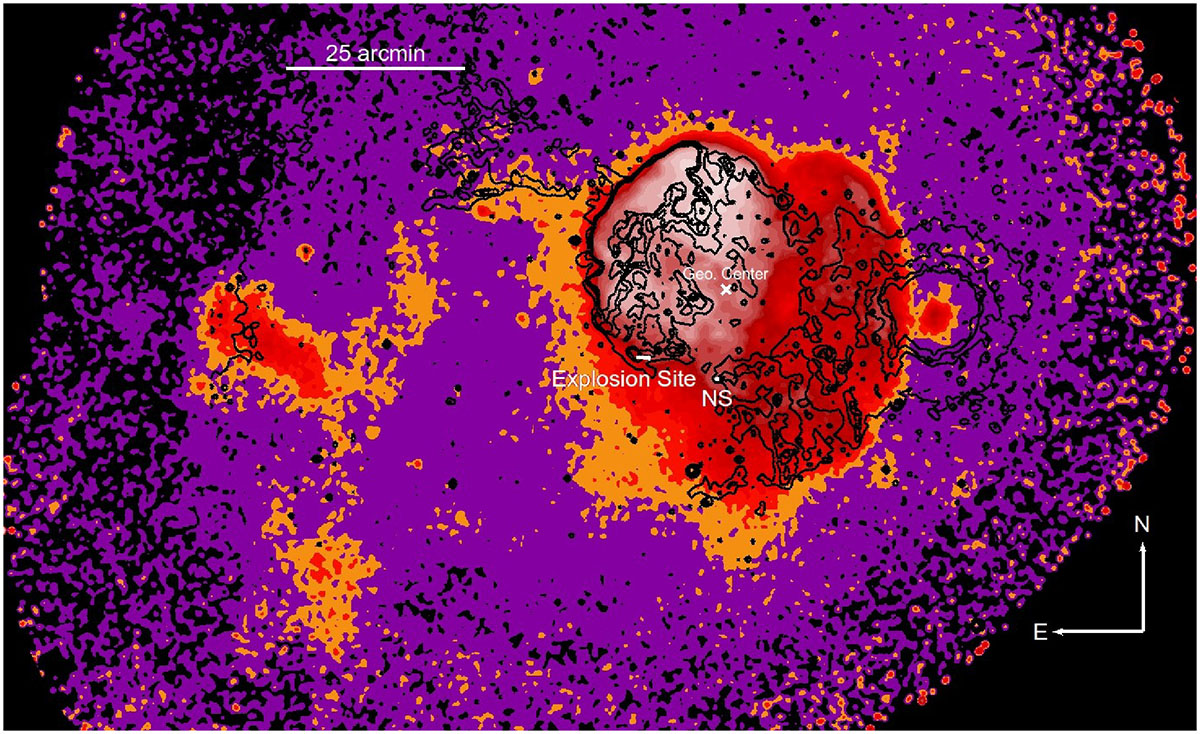
ROSAT PSPC (0.1–2.4 keV) image of the IC 443 region. The overlaid black contours represent the bright optical filaments. The explosion sites from 0 to 30 kyr are shown as a white cone. The geometrical center is denoted by a white cross, and the NS is denoted by a white circle. The SNR lies in a complex region together with SNR G189.6 + 03.3 and H II regions. However, its true extent toward the east-southeast is probably significantly larger, and the explosion sites we found are closer to the real geometrical center.
Current usage metrics show cumulative count of Article Views (full-text article views including HTML views, PDF and ePub downloads, according to the available data) and Abstracts Views on Vision4Press platform.
Data correspond to usage on the plateform after 2015. The current usage metrics is available 48-96 hours after online publication and is updated daily on week days.
Initial download of the metrics may take a while.