Fig. 1.
Download original image
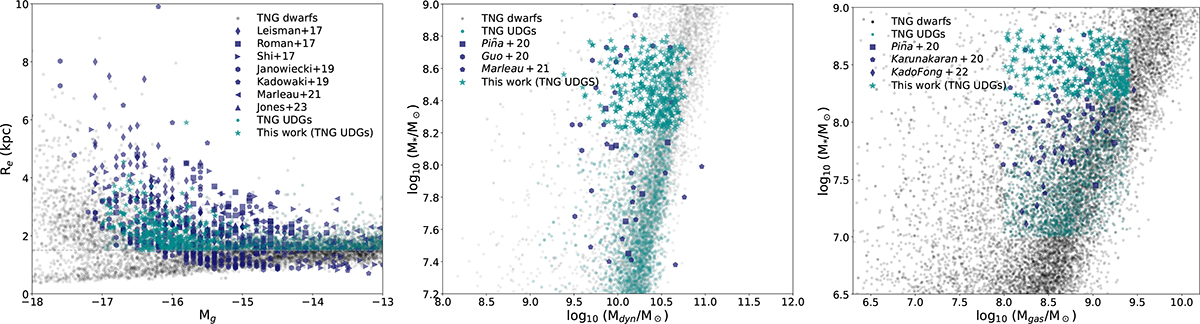
Distribution of the TNG50-1 UDGs selected in our sample in the (left) Mg − Re, (middle) M* − Mdyn, and (right) M* − Mgas space marked in teal stars. To compare with the observed populations, the UDGs obtained from Leisman et al. (2017), Román & Trujillo (2017), Shi et al. (2017), Janowiecki et al. (2019), Marleau et al. (2021), Kadowaki et al. (2021), Poulain et al. (2022), and Jones et al. (2023) are superposed on the left panel. Similarly, on the middle and the right panel, the stellar, dynamical, and gas masses of the UDGs taken from Guo et al. (2020), Mancera Piña et al. (2020), Karunakaran et al. (2020), Marleau et al. (2021), Kong et al. (2022), and Kado-Fong et al. (2022) are shown for comparison. The teal dots represent the remaining UDGs identified in TNG50-1 while the grey dots denote the whole sample space from which the UDGs were selected.
Current usage metrics show cumulative count of Article Views (full-text article views including HTML views, PDF and ePub downloads, according to the available data) and Abstracts Views on Vision4Press platform.
Data correspond to usage on the plateform after 2015. The current usage metrics is available 48-96 hours after online publication and is updated daily on week days.
Initial download of the metrics may take a while.