Fig. 10.
Download original image
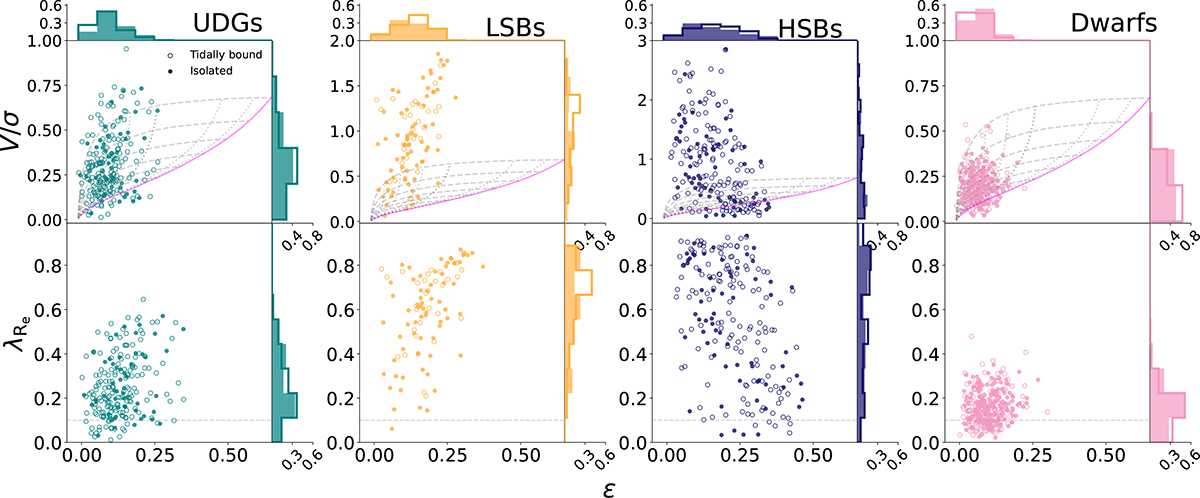
Distribution of our galaxy samples in (top) the V/σ versus ϵ space and (bottom) the λRe versus ϵ space following the same plotting scheme as Fig. 5. The solid magenta line represents the predicted theoretical distribution of the axisymmetric galaxies with the anisotropy parameter βz = 0.7ϵ at an inclination of 90°, and dotted lines from right to left denote the theoretical distribution for decreasing inclinations. The leftmost dotted line corresponds to the face-on orientation. The grey dashed lines correspond to locations of galaxies at edge-on orientations with intrinsic ellipticities of ϵ = 0.85 − 0.35 (see Cappellari et al. 2007; Emsellem et al. 2007).
Current usage metrics show cumulative count of Article Views (full-text article views including HTML views, PDF and ePub downloads, according to the available data) and Abstracts Views on Vision4Press platform.
Data correspond to usage on the plateform after 2015. The current usage metrics is available 48-96 hours after online publication and is updated daily on week days.
Initial download of the metrics may take a while.