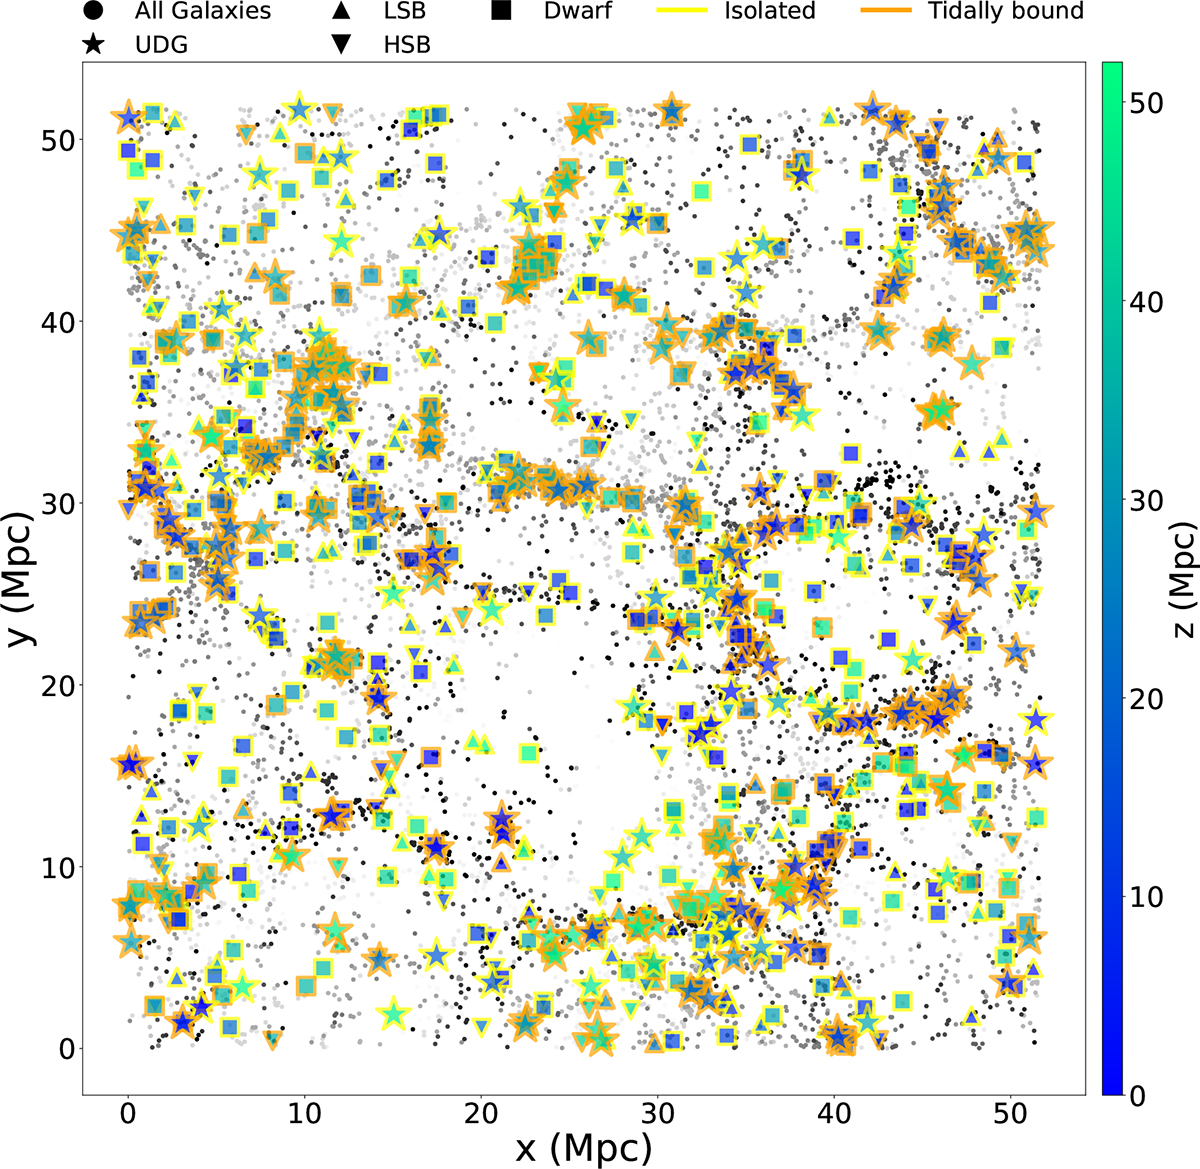
Fig. B.1.
Download original image
Distribution of the UDGs (★), LSBs (▴), HSBs (▾), and the dwarfs (◼) in the x-y plane of the TNG50-1 box. The isolated and tidally bound galaxies are represented with yellow and orange borders, respectively. The dots presented in grey scale represent the neighbouring galaxies in the TNG50-1 box. The variation in marker colour denotes the location of the galaxy on the z-axis (direction along the plane of the paper) - blue (black) denoting the nearest (∼ 0 Mpc) and green (fainter grey) denoting the farthest (∼ 50 Mpc comoving) galaxies of our sample (remaining in the box).
Current usage metrics show cumulative count of Article Views (full-text article views including HTML views, PDF and ePub downloads, according to the available data) and Abstracts Views on Vision4Press platform.
Data correspond to usage on the plateform after 2015. The current usage metrics is available 48-96 hours after online publication and is updated daily on week days.
Initial download of the metrics may take a while.