Open Access
Fig. 2.
Download original image
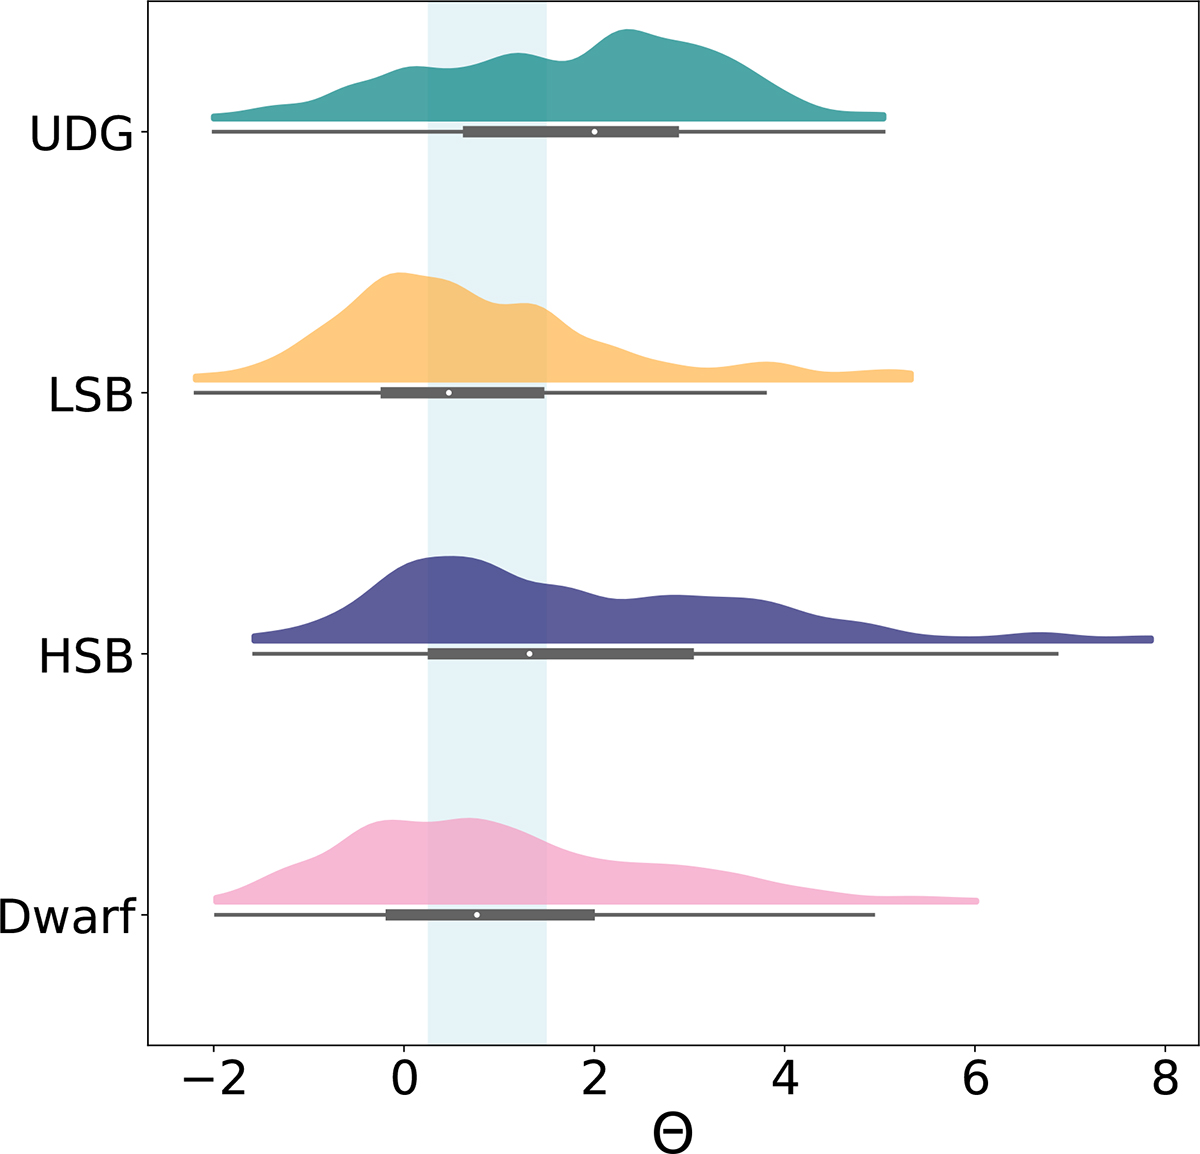
Distribution of the tidal index, Θ, for our galaxy samples. The UDGs are in teal, LSBs are in yellow, HSBs are in blue, and the dwarfs are in pink, along with their box plots. The blue region shows the buffer region that we rejected from our study.
Current usage metrics show cumulative count of Article Views (full-text article views including HTML views, PDF and ePub downloads, according to the available data) and Abstracts Views on Vision4Press platform.
Data correspond to usage on the plateform after 2015. The current usage metrics is available 48-96 hours after online publication and is updated daily on week days.
Initial download of the metrics may take a while.