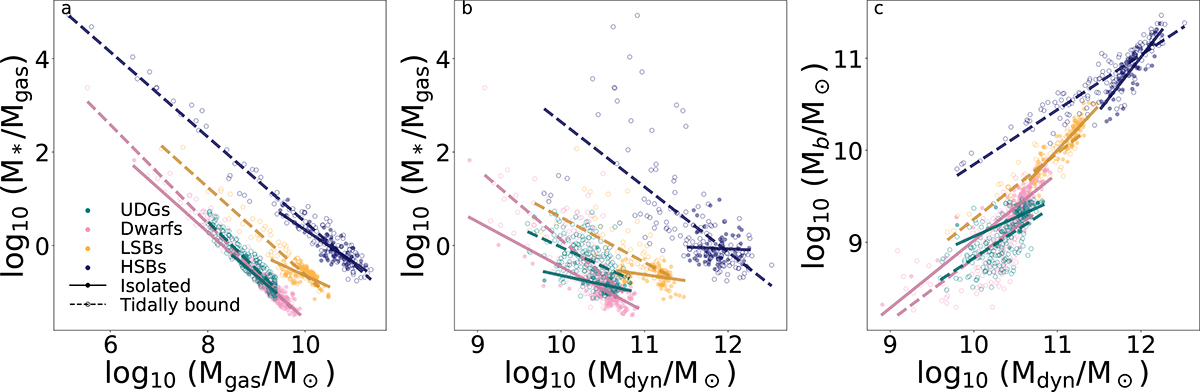
Fig. 4.
Download original image
Possible scaling relations of (a) stellar-to-gas mass ratio versus gas mass (log10M*/Mgas vs. log10Mgas), (b) stellar-to-gas mass ratio versus total dynamical mass (log10M*/Mgas vs. log10Mdyn), and (c) total baryonic mass versus total dynamical mass (log10Mb vs. log10Mdyn). The UDGs, LSBs, HSBs, and the dwarfs are shown in teal, yellow, blue, and magenta colours, respectively. Each of the galaxy samples are divided into two sub-samples – isolated (denoted with filled circles) and tidally bound (denoted with empty circles). The scaling relations are obtained for the two sub-samples of each galaxy classes separately and plotted with solid and dashed lines, respectively.
Current usage metrics show cumulative count of Article Views (full-text article views including HTML views, PDF and ePub downloads, according to the available data) and Abstracts Views on Vision4Press platform.
Data correspond to usage on the plateform after 2015. The current usage metrics is available 48-96 hours after online publication and is updated daily on week days.
Initial download of the metrics may take a while.