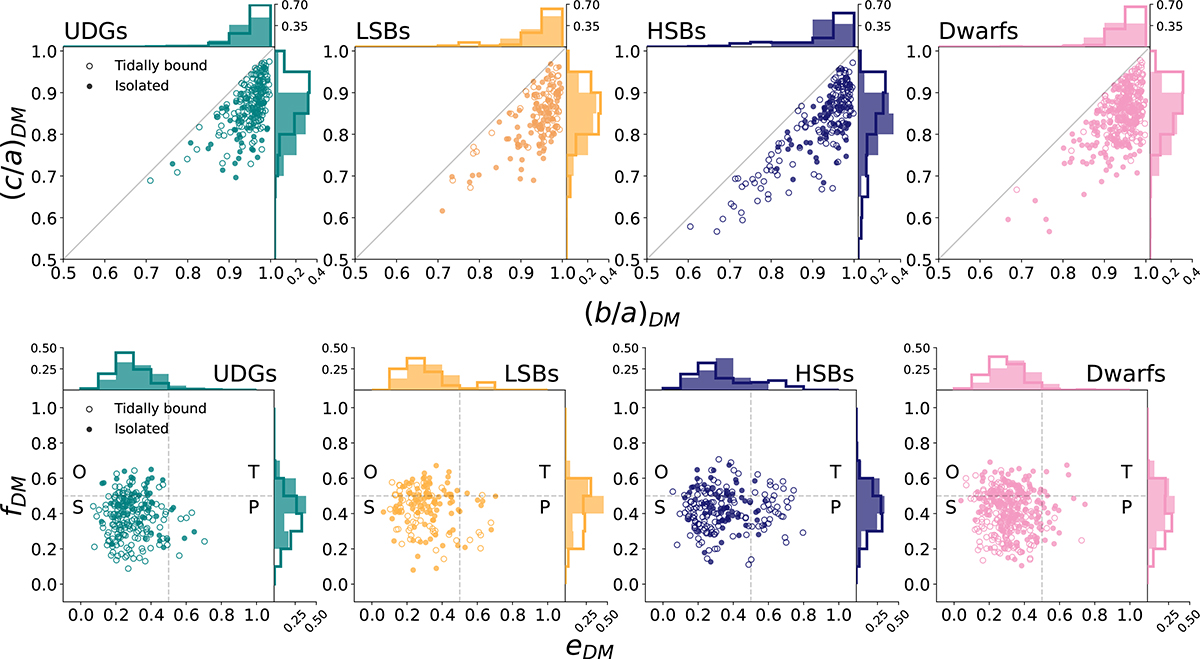
Fig. 5.
Download original image
Distribution of the (top) intermediate-to-major axes ratios versus minor-to-major axes ratios ((b/a)DM–(c/a)DM) and (bottom) elongation and flattening (eDM − fDM) of the DM component of our galaxy samples. The histograms of the x and y data are plotted on the top and right sides of each panel, respectively, with equal bin widths, showing the fraction of galaxies in each bin. The isolated galaxies are shown with filled circles and filled histograms, while the empty circles and empty histograms represent the tidally bound sub-samples. The same colour scheme as in Fig. 4 is adopted.
Current usage metrics show cumulative count of Article Views (full-text article views including HTML views, PDF and ePub downloads, according to the available data) and Abstracts Views on Vision4Press platform.
Data correspond to usage on the plateform after 2015. The current usage metrics is available 48-96 hours after online publication and is updated daily on week days.
Initial download of the metrics may take a while.