Fig. 8.
Download original image
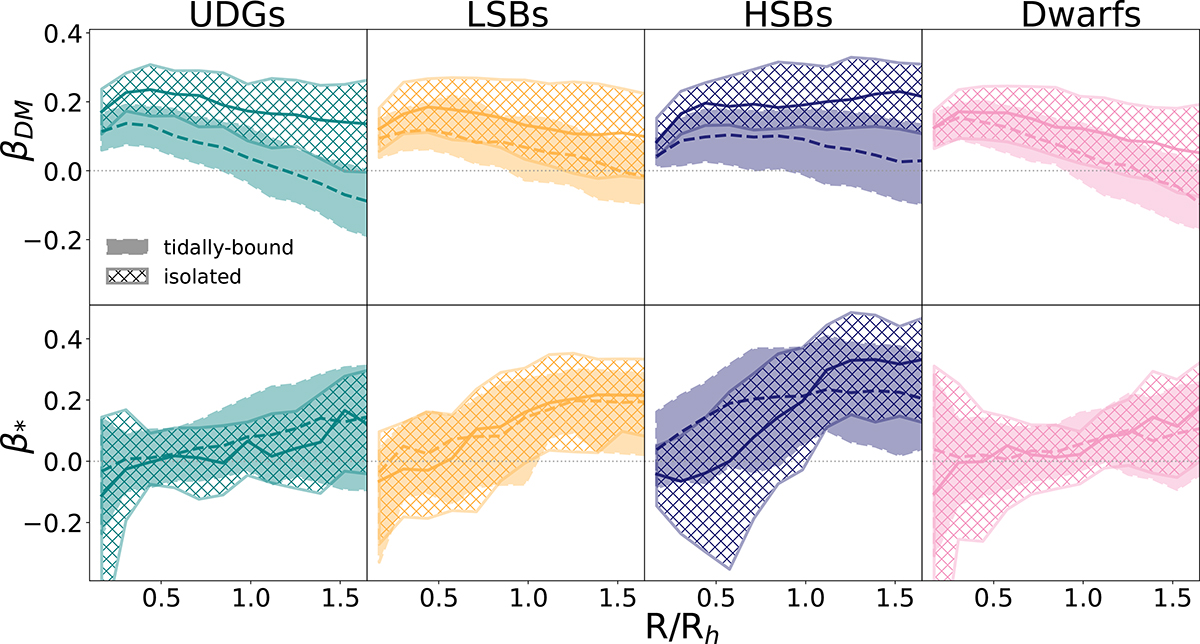
Variation of (top) DM (βDM) and (bottom) stellar (β*) velocity anisotropy as a function of galactocentric radius normalised by the respective half-mass radius. Solid and dashed lines represent the median values of the isolated and tidally bound galaxy sub-samples, respectively. The 25th and 75th quartile regions are shown with shaded regions: solid-filled regions are for the isolated sub-samples and crossed diagonal lines are for the tidally bound ones.
Current usage metrics show cumulative count of Article Views (full-text article views including HTML views, PDF and ePub downloads, according to the available data) and Abstracts Views on Vision4Press platform.
Data correspond to usage on the plateform after 2015. The current usage metrics is available 48-96 hours after online publication and is updated daily on week days.
Initial download of the metrics may take a while.