Fig. 1.
Download original image
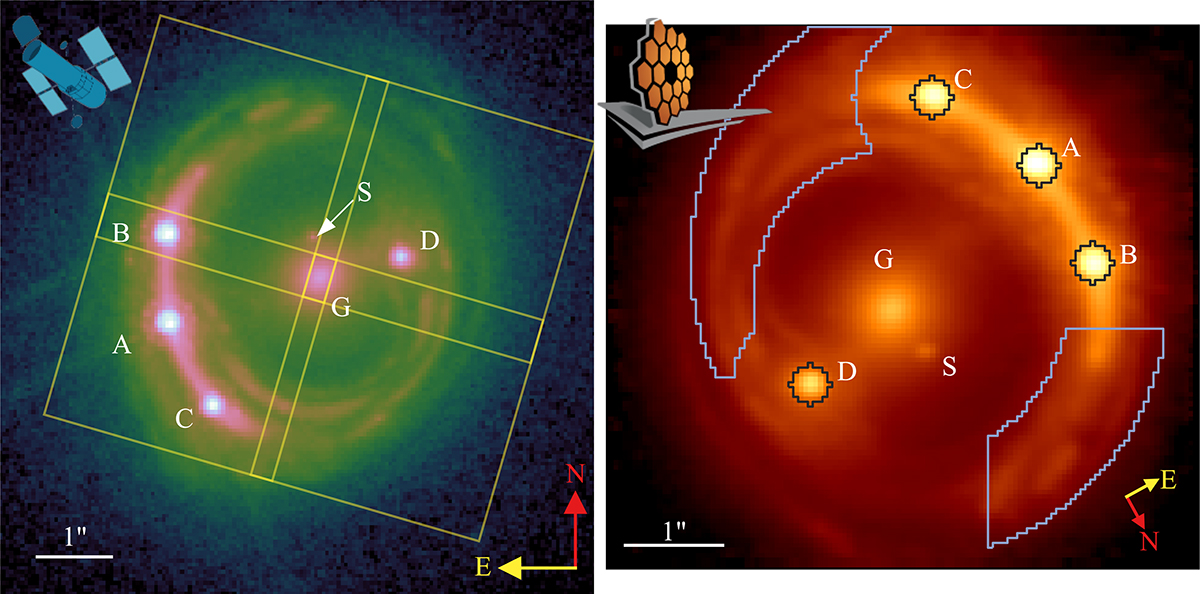
Imaging of the system RXJ1131−1231. Left panel: HST-ACS image in the F814W band. The four quasar images are labeled A, B, C, and D. The central deflector is marked with G, of which we are measuring the spatially resolved velocity dispersion. An arrow points to the nearby satellite S. The North and East directions, along with a 1″ scale, are also illustrated. The ![]() yellow squares represent the dithered 2 × 2 mosaic pattern of the NIRSpec IFU, which covers a
yellow squares represent the dithered 2 × 2 mosaic pattern of the NIRSpec IFU, which covers a ![]() field of view over the system. Right panel: “White-light” image of the system from the JWST-NIRSpec datacube, summed within 8255−8890 Å in the lens galaxy’s rest frame. The white bar represents 1″, and the red and yellow arrows point to the east and north, respectively. The blue contours show the region within which the spaxels are summed to obtain a high-S/N spectrum of the host galaxy. The black regions around the quasar images were used to extract summed spectra for modeling the quasar’s emission line components. HST and JWST logo credits: NASA.
field of view over the system. Right panel: “White-light” image of the system from the JWST-NIRSpec datacube, summed within 8255−8890 Å in the lens galaxy’s rest frame. The white bar represents 1″, and the red and yellow arrows point to the east and north, respectively. The blue contours show the region within which the spaxels are summed to obtain a high-S/N spectrum of the host galaxy. The black regions around the quasar images were used to extract summed spectra for modeling the quasar’s emission line components. HST and JWST logo credits: NASA.
Current usage metrics show cumulative count of Article Views (full-text article views including HTML views, PDF and ePub downloads, according to the available data) and Abstracts Views on Vision4Press platform.
Data correspond to usage on the plateform after 2015. The current usage metrics is available 48-96 hours after online publication and is updated daily on week days.
Initial download of the metrics may take a while.