Fig. A.1.
Download original image
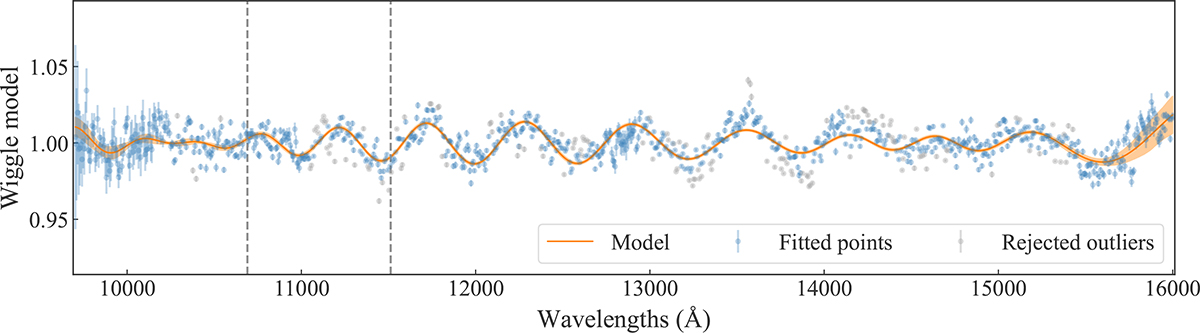
Fit wiggle model used to correct for the resampling noise. The data points show the signal of wiggle d(λ)/T(λ) for the central spaxel on the lens galaxy, where T(λ) is obtained from the best-fit model m(λ). The orange line shows the W(λ) function in the best-fit m(λ), with the orange shaded region illustrating the 1σ confidence region. The vertical gray dashed lines show the wavelength range containing the Ca II triplets of the lens galaxy that we fit to measure the lens galaxy’s kinematics. The gray data points are rejected outliers using the false discovery rate method.
Current usage metrics show cumulative count of Article Views (full-text article views including HTML views, PDF and ePub downloads, according to the available data) and Abstracts Views on Vision4Press platform.
Data correspond to usage on the plateform after 2015. The current usage metrics is available 48-96 hours after online publication and is updated daily on week days.
Initial download of the metrics may take a while.