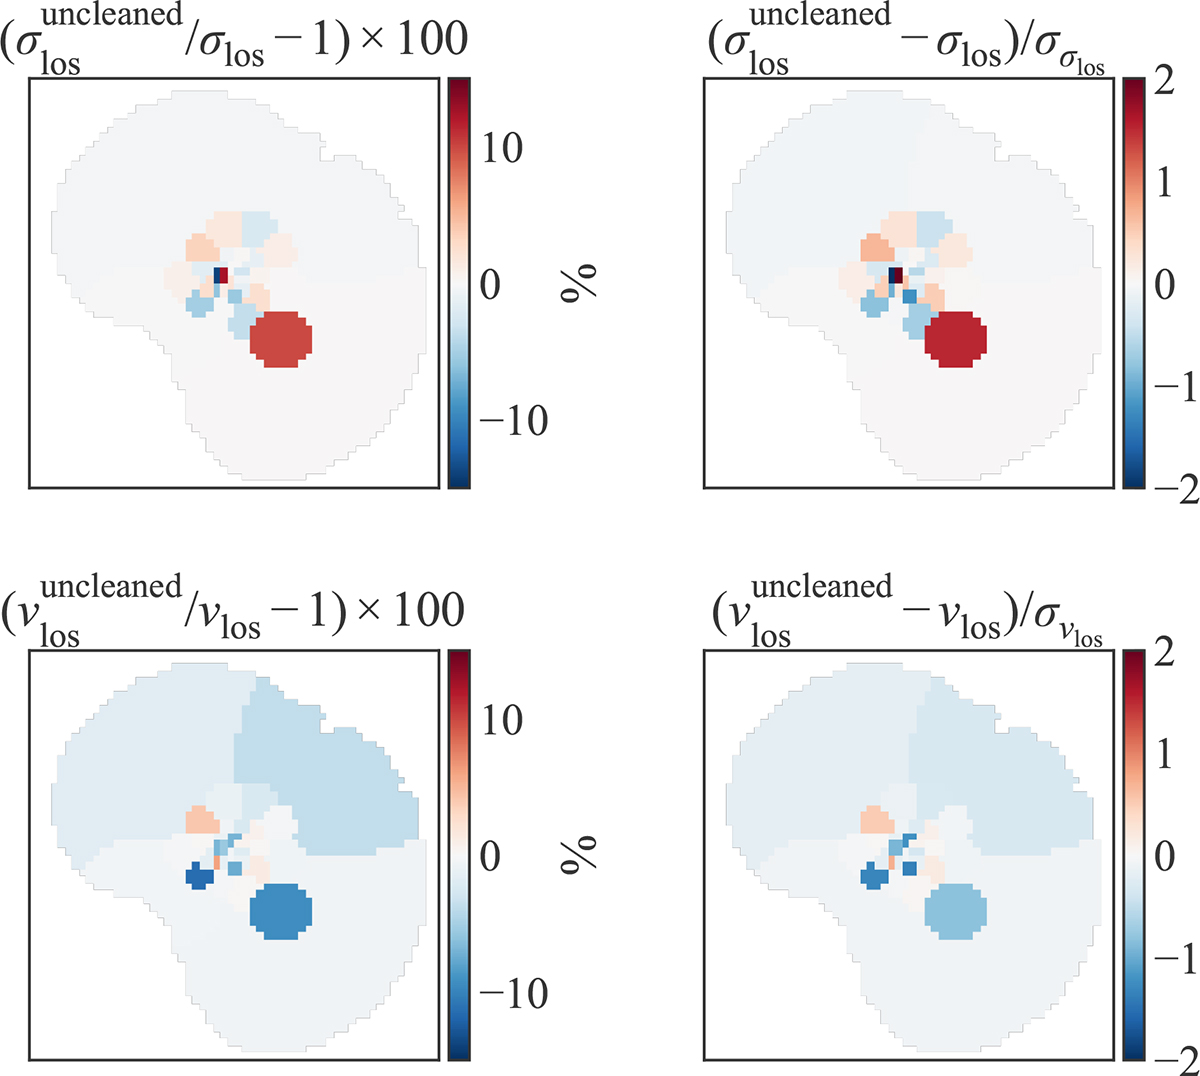
Fig. A.3.
Download original image
Impact of wiggle cleaning on the measured kinematics. The illustrated test is for a single model setup out of the 48 combinations described in Sect. 4.5. The first column displays the fractional differences in the measured dispersions (top row) and mean velocities (bottom row) within the Voronoi bins, while the second column shows these differences normalized by the statistical uncertainty.
Current usage metrics show cumulative count of Article Views (full-text article views including HTML views, PDF and ePub downloads, according to the available data) and Abstracts Views on Vision4Press platform.
Data correspond to usage on the plateform after 2015. The current usage metrics is available 48-96 hours after online publication and is updated daily on week days.
Initial download of the metrics may take a while.