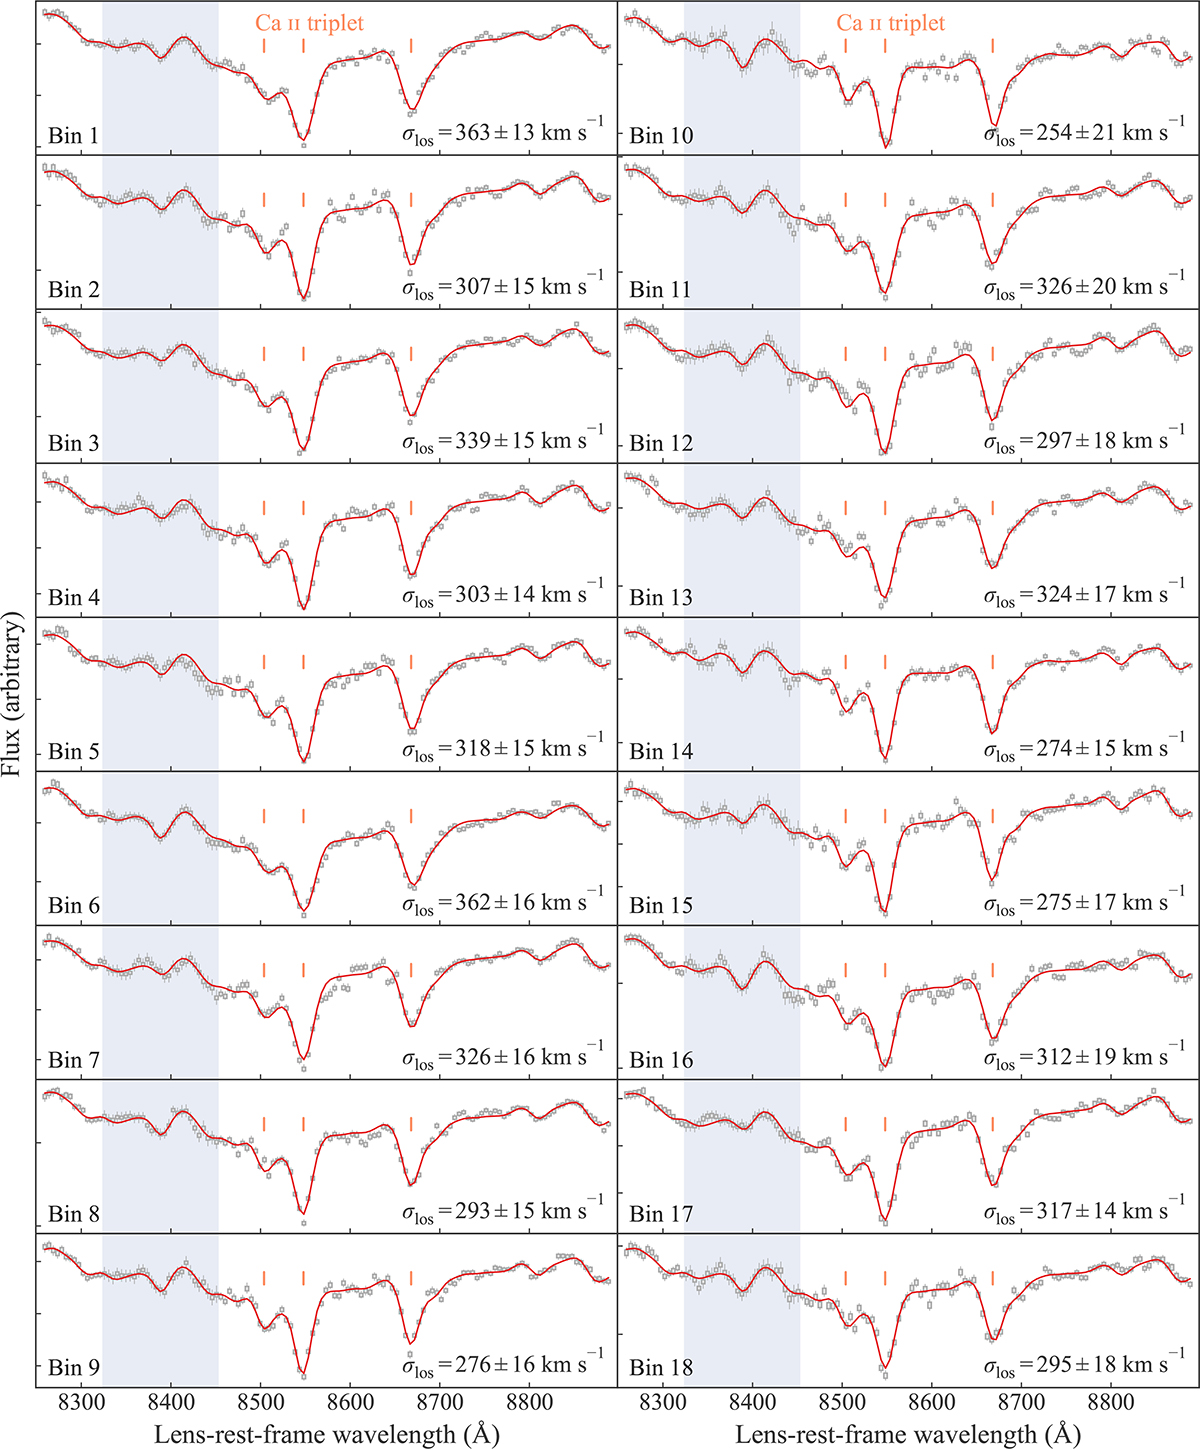
Fig. C.1.
Download original image
Individual kinematic fits for the first 18 out of the 32 Voronoi-binned spectra. The best-fit gas lines are subtracted for better visualization of the Ca II triplet features (marked with orange lines). The blue-shaded region marks where we boosted the noise levels around the Hα and N II lines. The gray bars represent the observed data, with the width marking the bin width and the height marking the original 1σ noise level. The vertical gray lines represent the boosted 1σ noise level. These 1σ noise levels for each bin are estimated from random sampling given the covariance matrix. The measured velocity dispersion σlos is also annotated in each panel.
Current usage metrics show cumulative count of Article Views (full-text article views including HTML views, PDF and ePub downloads, according to the available data) and Abstracts Views on Vision4Press platform.
Data correspond to usage on the plateform after 2015. The current usage metrics is available 48-96 hours after online publication and is updated daily on week days.
Initial download of the metrics may take a while.